
37
DRYING CASE STUDIES
John Gaertner, Nandkishor K. Nere, James C. Marek, Shailendra Bordawekar, Laurie Mlinar, and Moiz Diwan
Process Research and Development, AbbVie Inc., North Chicago, IL, USA
Lei Cao
Operations Science and Technology, AbbVie Inc., North Chicago, IL, USA
37.1 INTRODUCTION
This chapter presents various approaches used to apply the drying fundamentals covered in Chapter 35 to develop efficient and robust processes that consistently produce API, meeting the physicochemical requirements for small molecule compounds. In these case studies, an appropriate level of understanding is developed to ensure confident determination of the design space and a scalable process. This can be challenging at times due to the complexity of drying processes and the limited availability of appropriate scale‐down equipment and diagnostic tools. It can be further complicated by the wide variety of equipment used for drying.
The manufacture of an API involves many synthetic steps, producing a large number of intermediates. Many of these intermediates are crystallized, filtered/washed, and dried. In the drying of an intermediate, the levels of residual solvents must be reduced sufficiently to produce a stable compound; these solvents should not interfere with processing in the subsequent step. The drying of an API must generate solids with appropriate particle size distribution and crystal form and with residual solvent levels conforming to regulatory guidelines. The API drying step may need to maintain the crystal form produced by the crystallization or transform the crystal to the desired form. The properties of the dried API are particularly important since they may impact processing in the formulation steps.
Despite the common use of drying, this unit operation is not well understood. Heat and mass transfer in the solid phase can be complicated, requiring measurement of a large number of material‐dependent properties. There is complex interplay between material properties and liquid‐phase and vapor‐phase processes, as well as equipment‐dependent parameters. Typically, a limited amount of material is available in early development for use in drying studies; due to the unique properties of materials, the use of a surrogate is often unrealistic. Due to limitations in fundamental understanding of drying mechanisms and rates and inadequate knowledge of material properties, scale‐up often involves the use of empirical correlations with limited applicability and limited supporting data. Scale‐up correlations developed for one dryer type may be inappropriate for application to other dryer types due to the unique aspects of each dryer.
An objective of drying development is to develop an appropriate level of understanding to enable identification and addressing of potential issues that may arise during scale‐up or technology transfer to an alternate equipment train. The drying case studies presented here demonstrate this approach. These case studies include development of a computational model to simulate the drying process and application of this model to optimize drying parameters to limit drying cycle time. Also described are process transfer to alternate equipment, achieving the desired crystal form either through desolvation or humidification, and the application of relevant process analytical technology (PAT). Challenges encountered in pharmaceutical processing are also described.
A large number of different types of dryers are used in the pharma industry. Agitated filter dryers (AFDs) are commonly used due to their dual functionality (filtration and drying) and ability to safely process potent compounds. Other commonly used dryers include conical screw dryers (CSDs), spherical dryers, tumble (or biconical) dryers, and tray dryers. The first drying case study describes the development and scale‐up of a process using an AFD that was subsequently transferred to an equipment train employing a centrifuge and CSD.
37.2 PROCESS TRANSFER TO ALTERNATE EQUIPMENT TRAIN
A goal of process design and equipment selection in the manufacture of a compound is to achieve process efficiency and robustness while ensuring product quality attributes are met. In achieving efficient commercial production, processing may be constrained by the type of equipment in available equipment trains. The processing route and operating conditions may be modified to fit the equipment.
37.2.1 Development and Scale‐Up in Agitated Filter Dryers
The API compound is a channel solvate crystallized from a dual solvent solution. The crystal slurry is filtered to isolate the compound. The filter cake resistance and compressibility as measured by a leaf filter were low, indicating good pressure filtration (and centrifugation) characteristics. The crystal slurry filtration and cake wash are followed by a two hour nitrogen blow to deliquor and partially dry the wet cake. This reduces the wet cake solvent content to approximately 8–12 wt %.
TGA measurements of wet cake with an initial solvent content of 27 wt % showed that the drying rate starts falling when the solvent content drops to 11–12 wt % at which point the remaining solvent is largely internal to the crystals. The solvent content of the fully solvated crystal is 19 wt %. Based on TGA measurements, a minimum temperature of 80 °C is required to achieve a reasonable desolvation rate; these results were confirmed by means of drying rate measurements performed in a lab vacuum tray dryer at several temperatures. Based on these results, the final drying temperature was increased from 50 to 80 °C. The jacket temperature is ramped from 20 to 80 °C over six hours to limit the rate of solvent vapor generation, avoiding condensation in the dryer and vacuum line.
The propensity for particle attrition and agglomeration was measured in a lab‐scale AFD over a solvent content range of 28–0 wt %. There was no agglomeration or snowballing; however, attrition occurred over the entire range and was particularly high at high solvent concentrations. In scaling up to the pilot plant and production AFDs, attrition was managed by reducing the solvent content (by nitrogen cake blow) prior to initiating AFD blade rotation and by minimizing the number of AFD blade rotations. Agitation was initiated at low cake solvent content in which the particles are less sensitive to stress. The AFD blade is typically rotated 40 times at the lowest speed every two hours, achieving a total of approximately 900 revolutions during drying. Attrition was also measured in pilot‐scale AFDs. One batch that was exposed to a large amount of agitation (2200 revolutions) exhibited a approximately 50% reduction in particle size (see Table 37.1); this was greater attrition than a similar batch agitated for 610 revolutions at a slightly lower tip speed.
TABLE 37.1 Particle Size Distribution (PSD) of Crystal Slurry and Dried Crystals Filtered and Dried in Agitated Filter Dryers
| AFD | AFD Blade Revolutions | Blade Tip Speed (m/s) | Processing Point | Particle Size Distribution (μm) | ||
| D10 | D50 | D90 | ||||
| 0.6 m2 AFD | Crystal slurry | 30 | 74 | 142 | ||
| 610 | 0.23 | Dried crystals | 12 | 41 | 93 | |
| 0.3 m2 AFD | Crystal slurry | 13 | 38 | 112 | ||
| 2200 | 0.31 | Dried crystals | 6 | 21 | 55 | |
PSD measured by laser diffraction.
37.2.2 Production‐Scale Equipment Change
After successfully completing many batches at the production site, a switch from an AFD to a centrifuge and CSD was evaluated in order to increase throughput and free up the AFD equipment train for another compound. The modified process was developed at lab and pilot scales and then scaled up and demonstrated at production scale.
37.2.3 Switch from Pressure to Centrifugal Filtration
Centrifugation was demonstrated using a lab‐scale 12 cm diameter vertical bowl centrifuge with perforated bowl (Figure 37.1). This centrifuge is capable of generating a g‐force of approximately 600 g, which is less than 1000–1500 g at large scale. An additional limitation of the lab‐scale centrifuge is the low liquid head pressure (~15 psi) that is generated; this is less than the 100–200 psi at large scale. The decision to proceed to pilot scale was supported by polarized light microscopy (PLM) and particle size analyses that showed no significant fracture of crystals in centrifuged wet cake and wet cake from high pressure filtrations.

FIGURE 37.1 Tabletop vertical bowl centrifuge with perforated bowl.
Centrifugation was evaluated using two pilot‐scale centrifuges. The solvent content of washed centrifuge wet cake (~20 wt %) is higher than that of deliquored AFD wet cake (~8–12%) since the two hour nitrogen blow of the AFD wet cake is effective in evaporating a large fraction of the more volatile solvent (dichloromethane (DCM)), but less effective in removing the higher boiling ethyl acetate (EtAc) antisolvent. Consequently, the deliquored AFD wet cake contains a higher concentration of EtAc internal to the channel solvate crystals than centrifuge cake. In order to achieve similar solid‐state drying behavior in the two different equipment trains, similar wet cake solvent compositions prior to the start of heated drying were targeted. One approach to accomplish this is to sweep nitrogen through the washed wet cake in the centrifuge bowl; however, the available production‐scale centrifuge lacked this capability. An alternative approach consisting of modifying the composition of the centrifuge cake wash solution was pursued.
The primary purpose of the cake wash is to remove the mother liquor containing dissolved impurities from the cake. In order to ensure effective impurity removal, a plan to apply two sequential washes to the centrifuge cake was considered. The composition of the first wash was the standard 0.6 : 1 (w/w) EtAc: DCM; this composition approximates the mother liquor composition. This wash was followed by a wash solution with high EtAc composition. EtAc is an antisolvent, so the second wash may be less effective in removing impurities. This approach was rejected because it required dual solvent wash tanks for multiple centrifuge loads; however, just a single wash tank was available at the production site.
A single wash with high EtAc content was evaluated in lab‐scale centrifugation experiments (see Table 37.2). EtAc contents from 1.3 : 1 to 6.7 : 1 (w/w) EtAc : DCM were tested. Application of a wash of 2.7 : 1 EtAc : DCM increased the composition of the residual solvent in the centrifuge cake to 1.5 : 1; a further increase in the EtAc content of the applied wash did not further increase the EtAc content in the wet cake. The wash amount (6.4 kg/kg dry solids) used for the centrifugation matched the total wash amount used for the pressure filtration in the AFD. However, the wash solution has a short contact time with the centrifuge wet cake; this provides limited opportunity for DCM in isolated pockets of the wet cake to diffuse to the main flow channels in the cake. DCM present in the internal channels of the solvate crystals is more difficult to remove by the cake wash solution. The single wash with high EtAc content was shown to achieve acceptable removal of impurities present in the mother liquor, and the wash ratio of 2.7 : 1 was implemented.
TABLE 37.2 Effect of Wash Solution Composition on Lab‐Scale Centrifuge Wet Cake Residual Solvent Composition
| Cake Wash Composition (EtAc:DCM, w/w) | Wet Cake Residual Solvent Composition (EtAc:DCM, w/w) |
| 0.6 | 0.6 |
| 1.3 | 0.9 |
| 2.7 | 1.5 |
| 6.7 | 1.4 |
Cake LOD ~20 wt % after spin‐down.
X‐ray powder diffraction (XRPD) analyses of lab‐dried wet cake showed that a residual solvent EtAc–DCM ratio of 1.0 : 1 (w/w) or greater at the start of heated drying generates the desired solid structure when the wet cake is dried under appropriate conditions. So a residual solvent composition of 1.0 : 1 or greater was targeted for the centrifuge wet cake.
Residual solvent compositions exceeding 1.0 : 1 EtAc : DCM (w/w) were achieved in spun‐down centrifuge wet cake in pilot plant batches using a wash solution composition of 2.7 : 1 EtAc : DCM (Table 37.3) for vertical bowl and horizontal peeler centrifuges (Figure 37.2).
TABLE 37.3 Effect of Wash Solution Composition on Pilot‐Scale Centrifuge Wet Cake Residual Solvent Composition
| Pilot‐Scale Centrifuge | Scale (Total Dry Solids kg for All Drops of the Batch) | Cake Wash Composition (EtAc:DCM, w/w) | Wet Cake Residual Solvent Composition (EtAc:DCM, w/w) | Wet Cake Residual Solvent Content (wt %) |
| Vertical bowl | 15 | 0.6 | 0.5 | 22 |
| Horizontal peeler | 80 | 0.6 | 0.6 | 18 |
| Vertical bowl | 41 | 0.6 | 0.5 | 23 |
| Vertical bowl | 9 | 2.7 | 1.3 | 22 |
| Horizontal peeler | 33 | 2.7 | 2.6 | 31 |
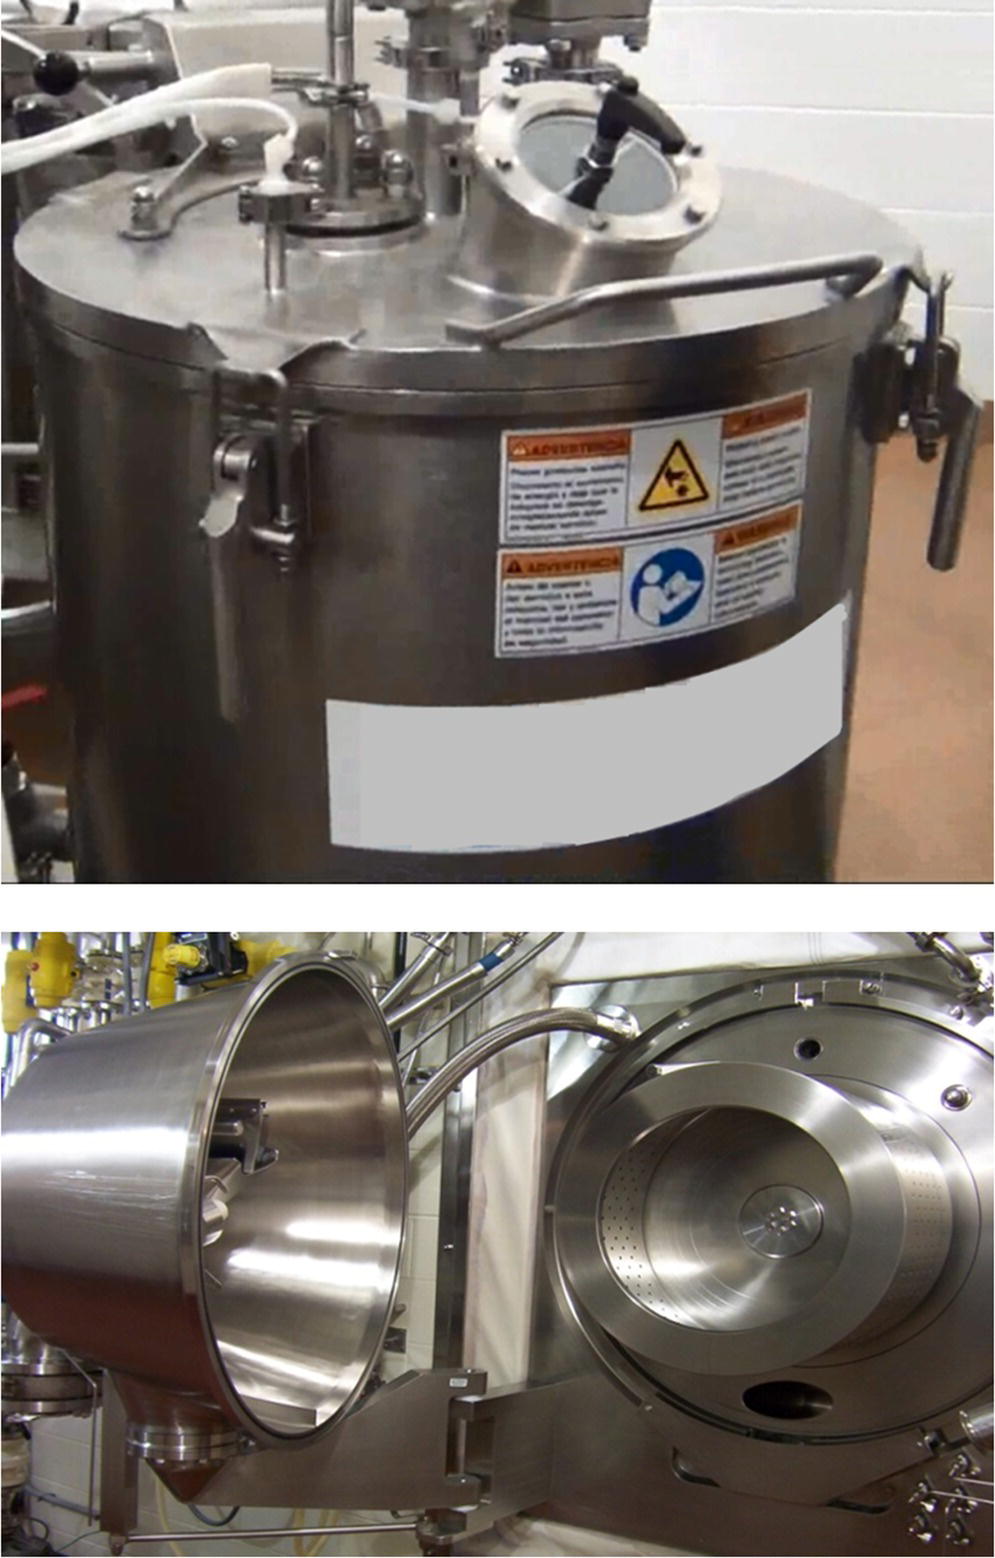
FIGURE 37.2 Vertical bowl (top) and horizontal peeler (bottom) pilot‐scale centrifuges.
Operating conditions and process data for representative centrifugations are summarized in Table 37.4. The g‐forces used for slurry loading/cake washing and for final spin down in the pilot batches with the largest pilot plant centrifuge (horizontal peeler) were similar to those implemented at production scale.
TABLE 37.4 Centrifuge Operating Conditions at Lab, Pilot, and Production Scales
| Scale | Centrifuge | Bowl ID (cm) | Speed (rpm) | G‐Force | LOD of Spun Cake (wt %) | Wet Cake per Drop (kg) | |
| Lab | Vertical bowl | 12 | Slurry loading; cake washing | 1000 | 67 | 0.1 | |
| Final spin | 3000 | 605 | 23 | ||||
| Pilot | Vertical bowl | 40 | Slurry loading; cake washing | 1000 | 224 | 9 | |
| Final spin | 2000 | 894 | 22 | ||||
| Pilot | Horizontal peeler | 63 | Slurry loading; cake washing | 900 | 286 | 19 | |
| Final spin | 1800 | 1143 | 20 | ||||
| Production | Horizontal inverted bag | 80 | Slurry loading; cake washing | 900 | 363 | 35 | |
| Final spin | 1600 | 1147 | 20 |
The wet cake produced using the pilot‐scale centrifuge with highest g‐force exhibited an acceptable degree of attrition relative to the crystal slurry feed (Table 37.5).
TABLE 37.5 Particle Attrition Resulting from High G‐Force Centrifugation
| Particle Size Distribution (μm) | |||
| D10 | D50 | D90 | |
| Crystal slurry | 19 | 45 | 94 |
| Spun filter cake | 16 | 40 | 86 |
The process was transferred to the production‐scale train, which employs a horizontal inverting bag centrifuge. Application of a cake wash with a 2.7 : 1 (w/w) ratio of EtAc : DCM generated a final wet cake residual solvent composition of 1.1 : 1 EtAC : DCM; this met the target of greater than or equal to 1.0 : 1. In the new production train, the centrifuge wet cake is transferred to a CSD for the subsequent drying operation.
37.2.4 Development and Scale‐Up in Conical Screw Dryer
Advantages of CSDs include high heat and mass transfer coefficients resulting from agitation that exposes fresh wet solids to the heated surfaces and headspace. Screw rotation achieves mixing in the radial and axial directions, while screw orbiting mixes in the angular dimension. The gentle agitation introduces relatively little stress, resulting in less particle attrition for many compounds.
Lab‐ and pilot‐scale drying studies were performed to develop and scale up the conical screw drying to a 3000 L production‐scale dryer. CSD equipment information is summarized in Table 37.6. Large CSDs have significantly less heat transfer area per volume of cake than a lab‐scale CSD. All of the dryers have a tapered screw that achieves better mixing and conveying of solids near the top of the dryer than a cylindrical screw. The screws for the lab‐ and pilot‐scale CSDs have closed flights that provide more area for vertical solid conveyance, while the production‐scale dryer screw has open flights (lacking recesses) that facilitate screw cleaning.
TABLE 37.6 Equipment Parameters for Lab‐, Pilot‐, and Production‐Scale CSDs
| Scale | Lab | Pilot | Plant |
| Maximum working volume (L) | 1.5 | 30 | 3000 |
| Heated wall area/vol (1/dm) | 3.8 | 1.4 | 0.3 |
| Screw | Tapered | Tapered | Tapered |
| Flight design | Closed flight | Closed flight | Pharma open flight |
| Max tip speed (m/s) | 0.41 | 0.89 | 1.63 |
Since the drying rate of the lab 1.5 L CSD (Figure 37.3) is not readily scalable to large dryers, the lab experiments focused on the impact of drying process parameters and mechanical stress on particle physical properties (e.g. attrition and agglomeration). In one experiment, drying with constant agitation (at 40% of maximum speed) was continued for 17 hours after drying completion; this extended period of agitation of the dried particles resulted in essentially no particle attrition. Similarly, agitation at maximum tip speed did not attrite the particles. The ease of heel removal from the wall during dryer unloading was also assessed. A mass spectrometer was employed to monitor drying rate, facilitate the decision on drying completion, and help detect an improper mechanical seal in the dryer. Wet cake from the pilot‐scale centrifuge was used for these studies.

FIGURE 37.3 1.5 L conical screw dryer.
Pilot‐scale studies in the 30 L CSD using centrifuge wet cake were performed to measure the effect of different profiles of agitation, vacuum pressure, and jacket temperature on drying rate and dried particle properties. Heat and mass transfer rates of the 30 L dryer can be used for scale‐up (within certain constraints); this is typically done by measuring the drying rate of a pilot‐scale batch employing the design temperature, pressure, and agitation profiles. The drying rate is expressed as a function of the residual solvent content (see Figure 37.4). The resulting drying rate curve is typically divided into three or more regions that correspond to different rate‐controlling mechanisms.

FIGURE 37.4 Drying rate curve showing different regions used for scale‐up calculations.
The drying rate for a particular region of the curve is similar across scales. The drying time for each region is calculated separately using Eqs. (37.1) and (37.2):

where
-
 (hours).
 -
 is the falling rate region 1 drying time (hours).
 - mdry is the dry mass (kg).
- X is the solvent content of cake (kg solvent/kg dry cake).
- A is the heat transfer area (m2).
- ṁc is the drying rate of constant rate region (kg/m2/h).
The total drying time is the sum of the individual drying times: ttotal = tC + ![]() +
+ ![]() . Scale‐up using the drying rate curve approach assumes equivalency across scales of heat and mass transfer coefficients, temperature driving forces, vacuum pressure, nitrogen sweep, mixing, dryer geometry, and cake characteristics.
. Scale‐up using the drying rate curve approach assumes equivalency across scales of heat and mass transfer coefficients, temperature driving forces, vacuum pressure, nitrogen sweep, mixing, dryer geometry, and cake characteristics.
The mixing turnover time is calculated using equations 37.3 and 37.4 and is maintained across scales:
where
- D is the screw outer diameter (cm).
- d is the screw shaft diameter (cm).
- n is the screw rotation speed (rpm).
- P is the screw pitch (cm).
For open flight screws, the screw shaft diameter is replaced with an equivalent diameter selected to reflect the reduced flight area available for conveyance. For the case at hand, a mixing turnover time of three minutes is achieved in the pilot‐ and production‐scale CSDs (filled to capacity) using screw rotation speeds of 11 and 45 rpm, respectively. The ratio of screw rotation speed (rpm) to orbiting speed (rpm) is maintained at 50–100 to ensure mixing in all three spatial dimensions.
Solvent vapor is removed through a vacuum port on the top of the CSD. The upward transport of solids by the screw brings fresh solids to the surface, resulting in a high vapor mass transfer coefficient. Nitrogen may be applied to the bottom of the CSD to further improve mass transfer by providing a convective sweep resulting from the flow of N2 from the bottom to the top of the bed. In pilot studies, it was found that substantial particle attrition resulted from a high N2 gas velocity; similarly high attrition also resulted from a leak in the bottom discharge valve of the CSD that led to airflow into the bottom of the evacuated CSD. For this reason, N2 was not applied to the bottom of the CSD, and the importance of a pre‐batch vacuum leak test of the CSD was emphasized. For other less stress‐sensitive products, application of a slow N2 flow to the CSD bottom may be appropriate; in this case, the additional flow area provided by a sintered N2 distribution ring at the bottom of the CSD may result in reduced N2 gas velocity and less particle attrition in comparison with an N2 distributor consisting of just a few drilled holes that provide a small N2 injection area.
A low level of attrition of crystals during agitated drying was measured in lab‐ and pilot‐scale CSD tests; consistent results were obtained in the plant CSD. Table 37.7 compares the size of the crystals composing the centrifuge wet cake charged to the CSD with the size of the dried crystals. The degree of attrition in the CSD is less than half of the attrition measured in the AFD – despite the use of continuous agitation in the CSD. For both dryer types, agitation was initiated soon after the dryer jacket reached its final temperature of 80 °C.
TABLE 37.7 Reduction in Particle Size of Crystals (i.e. Attrition) During Drying in AFD and CSD
| Dryer Type | Scale | Agitation Frequency | Tip Speed (m/s) | Particle Size Reduction (%) | ||
| D10 | D50 | D90 | ||||
| AFD | Plant | Intermittent, 5 min every 2 h | 0.34 | 85 | 61 | 50 |
| CSD | Lab | Continuous | 0.14 | 21 | 23 | 18 |
| CSD | Pilot | Continuous | 0.18 | 29 | 32 | 22 |
| CSD | Plant | Continuous | 1.05 | 25 | 26 | 25 |
Expressed as drop in particle size relative to size of particles in initial wet cake.
The information generated by the lab‐ and pilot‐scale studies enabled a successful scale‐up and demonstration batch in the production‐scale CSD. The desired crystal structure was achieved by desolvating the crystal solvate at high temperature by rapidly heating the dryer jacket to 80 °C with no agitation and limited vacuum. The vacuum level in the initial drying phase was sufficient to avoid vapor condensation in the CSD and vacuum exhaust line; it also limited the amount of vaporization and resulting cooling. Agitation and high vacuum were applied after the jacket temperature reached 80 °C; the agitation distributed the heat imparted by the jacket. Residual solvents were reduced to passing levels within 36 hours of drying after high vacuum was achieved.
37.3 OPTIMIZATION OF SOLVATE DRYING THROUGH HEAT TRANSFER MODELING
There is no universal protocol for drying using an AFD that is applicable to all pharmaceutical compounds; this is due to differences in physicochemical properties of the wet cake and the desired dried product attributes. Optimization of AFD performance for a given compound requires the proper determination of operating parameters including the headspace pressure, nitrogen sweep rate, level of applied vacuum, duration and intensity of mixing, and jacket and mixing blade temperature. In the prior case study, the API solids dried sufficiently rapidly that it was unnecessary to reduce the cycle time through an intensive computational analysis of drying. In other cases, drying can be a significant bottleneck and warrants deeper study. This was the case for the drying of an early‐stage API candidate that required excessively long cycle times in a pilot plant AFD. Modeling was shown to be of great utility in determining proper operating conditions specific to the compound. Insights from modeling reduced experimental efforts (saving expensive materials), improved understanding of the drying process at bench scale, and ensured predictable robust performance on scale‐up. The key to increasing the drying rate was to minimize mass transfer limitations and to ensure sufficient heat transfer by use of an appropriate mixing protocol. A composite model was developed that incorporates models for heat transfer and desolvation kinetics. The heat transfer model accounts for the effect of a gas gap between the dryer wall and adjacent API solids on the overall heat transfer coefficient. It also accounts for the effect of headspace pressure on the mean free path length of the inert gas and therefore on the heat transfer between the vessel wall and the first layer of solids. The computational methodology was developed using a modified model framework within commercially available simulation software. An AFD operational protocol was designed based on the desolvation kinetics, thermal and crystal form stability, and the understanding gained through model simulations. Implementation of this protocol reduced the drying time fourfold.
37.3.1 Desolvation Kinetics and Form/Thermal Stability
The intrinsic desolvation kinetics were calculated by measuring the solvent (ethanol) content as a function of time in dynamic vapor sorption (DVS) experiments carried out at three different temperatures (40, 60, and 70 °C) under nitrogen sweep. A thin layer of solids and high N2 sweep rate were used to minimize the mass transfer resistance and ensure measurement of intrinsic desolvation rate. The net desolvation rate constant (kD; units of s−1) for each temperature was calculated by fitting the desolvation data to first‐order kinetics. The resulting rate constants were graphed in an Arrhenius plot to quantify the temperature (T in K) dependence:
Drying results of early pilot plant batches were consistent with the findings of the desolvation kinetics study. In early pilot plant batches, the dryer was operated at a nominal jacket temperature of 50 °C, resulting in a maximum internal temperature of about 40 °C; the drying process took nearly a week at this temperature to reduce the ethanol content to an acceptable level (≤0.1 wt %).
Thermal stability and form stability studies were performed to determine the maximum acceptable drying temperature. At temperatures above 80 °C, wet cakes began to discolor – indicating thermal degradation. For the case of properly deliquored wet cake, the desolvate was shown by XRPD to be the stable crystal form at temperatures below 80 °C, which is well below the API melting temperature of approximately 150 °C. Amorphization of the desolvate crystal was not observed under these conditions.
37.3.2 Composite Drying Model
Drying of this compound consists of two main phases. The first phase is relatively short and consists of rapid evaporation of unbound solvent accomplished by the nitrogen cake blow that follows proper cake deliquoring. Desolvation is insignificant during this phase due to its high energy barrier.
The second phase consists of removal of bound solvent (primarily as solvent internal to the crystals) in three steps:
- Desolvation: The first step is the desolvation of the ethanol solvate. The net desolvation rate (RD) is governed by temperature. The desolvation results in the separation of solvent in liquid form:

- Evaporation: The second step is the evaporation of the free liquid solvent after desolvation:

- Convection: In the third step, the evaporated solvent is convected away by the nitrogen sweep. The nitrogen is expected to flow around the particles at a sufficiently high velocity to alleviate diffusion limitations in this third step.
The desolvation and evaporation rates depend on the local temperature and heat transfer rate, which are governed by the physical properties of the cake, jacket fluid temperature, heat transfer area, and the mixing provided by the agitator. By applying a sufficient nitrogen gas flow rate for rapid convection of solvent vapor, desolvation or evaporation becomes the rate‐determining step. The effective rate of solvent loss is the smaller of the desolvation rate and the solvent evaporation rate. At a given temperature T, the desolvation rate is readily calculated using the equation RD = kD(T)Cs,b, where Cs,b is the ratio of the mass of the bound solvent in the form of solvate to the mass of desolvated solids.
The heat transfer model used in the simulation is based on the penetration theory proposed by Tsotsas and Schlunder [1] with a few modifications. The heat transfer mechanism is dominated by thermal conduction. The AFD is divided into three regions in the heat transfer analysis: (i) the vessel wall, (ii) the gap between the outer layer of the dry solid bed and the vessel wall (this is assumed to be composed of the first layer of solids and gas gap), and (iii) the dry solids. Further description of the mathematical modeling is provided in Ref. [2].
In the absence of agitation during drying, a gas gap is created by preferential flow of N2 along the vessel wall, generating additional resistance to heat transfer. The contribution of this gas gap to the overall heat transfer resistance was found to be 10–50% depending on the fraction of wet solids; this justifies its incorporation in the heat transfer model. The model also incorporates an equation for the contact heat transfer coefficient (hws) by Hoekstra et al. [3] for the first layer of solids adjacent to the dryer wall; hws is inversely dependent on the mean free path length for N2 gas molecules. Use of this equation enables simulation of the effect of dynamic pressure in the filter dryer. The pressure variation may be significant due to the N2 gas flow rate, the vacuum drawn at the AFD bottom, and dynamics of pressure drop across the cake. A headspace pressure increase from 50 to 1000 mbar absolute increases hws by 2.5x.
37.3.3 Regression of Model Parameters Through Simulations
All simulations were carried out using the modified model framework within a commercially available simulation software. The contact time for mixing was calculated from the mixing number, Nmix, which is empirically related to the Froude number. Two constants in the Nmix correlation that are characteristic of the agitator type were estimated by forcing a reasonable fit of the model results with the temporal profiles of the measured solvent content and solids temperature of an early pilot plant batch (Figures 37.5 and 37.6).

FIGURE 37.5 Model fit of the measured cake solvent content of early pilot plant batch.

FIGURE 37.6 Model fit of the measured internal temperature of early pilot plant batch.
The initial solvent composition of 5.4 wt % in Figure 37.5 represents the first available measurement. This solvent content is below the bis‐solvate solvent composition of 8.8 wt %, indicating that the crystals are partially desolvated when heated drying is initiated after the completion of the nitrogen blow of the cake. Note in Figure 37.6 the initial phase where the solids temperature increases (from ~19 °C used for the N2 blow) before attaining a somewhat steady value. The time at which the internal temperature achieves a somewhat steady value corresponds to mono‐solvate composition based on Figures 37.5 and 37.6. The first solvent molecule of the bis‐solvate likely has a lower energy barrier for desolvation than the second solvent molecule. During removal of the first solvent molecule, evaporation of the desolvated solvent may be the rate‐determining step, thereby increasing the solids temperature. The thermocouple tip is flush with the AFD wall surface and is in contact with the gas flowing through the gap between the dryer wall and the solids. Consequently, the measured temperature does not exactly match the dry solids temperature predicted by the model. This is supported by the observed jumps in the measured temperature during the mixing period as shown in Figure 37.6.
37.3.4 Improved Drying Through Model Simulations
Simulations were performed using the computational model to better understand the dynamics of agitated drying. The heat transfer rate is dependent on the jacket temperature and the agitation speed and time. A jacket temperature upper limit of 70 °C was imposed to assure thermal stability of the product and acceptable crystal form, which in this case demanded a gradual increase in the drying temperature. It was seen that the agitation frequency, duration, and speed play a significant role in enhancing the drying rate. Continuous agitation results in the fastest drying at a given jacket temperature. Since agitation can also result in significant attrition of product crystals, intermittent agitation is commonly used in practice. The mixing period and intensity that produce acceptable particle attrition form a practical basis for the design of the agitator operating protocol. Model simulations were run using various headspace pressures and agitation profiles and yielded the improved drying protocol in Figure 37.7.

FIGURE 37.7 Target jacket temperature, intermittent mixing (M), and cake smoothing (S) profiles determined through model simulations and practical considerations.
Prior to the start of heated contact drying, the wet cake is blown with nitrogen for three hours. The jacket temperature is then gradually increased over 12 hours to avoid excessive heating of wet cake with unbound solvent as it may result in the formation of a dry coating on the jacketed wall, reducing the heat transfer rate. No agitation is performed at high cake solvent content to avoid agglomeration induced by mixing that can generate hard lumps upon heating – potentially reducing the drying rate. The original and improved drying protocols are compared in Table 37.8.
TABLE 37.8 Comparison of Original Drying Protocol and the Protocol Optimized Through Improved Understanding from Model Simulations
| Operational Parameter | Older Drying Protocol | New Drying Protocol |
| Jacket temperature (°C) | 50 | 70 |
| Average headspace pressure (mm Hg) | 300 | 250 |
| Total mixing time (min) | 175 | 360 |
| Mixing rpm and frequency | 10 rpm for 5 min every hour for first 15 h, followed by mixing at 10 rpm for 5 min every 6 h | No mixing for first 6 h, followed by 30 min of mixing at 2 rpm every 3 h for first 9 h, followed by 30 min of mixing at 3 rpm every 2 h |
In the improved drying protocol, the agitation speed is reduced to reduce particle breakage and attrition, while the total mixing time is increased. This protocol was implemented in a pilot plant batch. Figure 37.8 compares the model predictions and observed drying performance, demonstrating that the model simulations are in close agreement with the measured solvent content throughout the drying process.

FIGURE 37.8 Comparison of model predictions of wet cake solvent content with pilot plant measurements for improved drying profile.
The drying time to reduce the residual solvent content to 0.1 wt % (from 8.8 wt %) was approximately 35 hours. This constitutes a fourfold reduction from the 140 hours required in the early pilot plant batch. Four additional API pilot plant batches were dried using the improved operating conditions. Figure 37.9 depicts the temporal profiles of measured solvent content for all five batches dried using the improved protocol. All batches showed similar drying performance, thereby verifying the computational model description of the drying process. The model could not be verified beyond one set of operating parameters at scale due to constraints on the use of pilot plant equipment and the high API cost.
FIGURE 37.9 Measured wet cake solvent temporal profiles for five pilot plant batches performed using improved drying protocol.
37.3.5 Guidelines for AFD Operation
On the basis of the model studies, pilot‐scale demonstration, and practical considerations, the following guidelines are recommended to achieve efficient AFD operation. In practice, the drying protocol will need to be tailored to address the specific issues related to the physicochemical characteristics of the particular product:
- Efficient N2 flow through the entire cake is important; the headspace pressure should not be allowed to increase beyond the point that causes cake compression, decreased inert gas flow rate, or increased mass transfer resistance. Intermittent cake smoothing must be performed to prevent preferential inert gas channeling or bypassing. This will alleviate mass transfer limitations relating to the movement of solvent vapors.
- Cake that is substantially wet should not be mixed in order to avoid granulation. The wet granules can form hard lumps upon heating that can be difficult to dry, resulting in increased drying time.
- Heat the wet cake gradually after ensuring deliquoring to the fullest practical extent. Heating wet cake with unbound solvent in the proximity of vessel wall may result in formation of a dry coat on the jacketed wall, causing fouling and a reduced heat transfer rate. An excessively high vaporization rate can also result in condensation within the dryer, resulting in formation of liquid droplets that may promote dissolution or granulation.
37.4 DRYING WITH HUMIDIFIED NITROGEN
In the prior agitated filter drying case study, elevated temperature was used to desolvate the API to achieve the desired desolvated crystal form. A significant number of APIs are hydrates; many of these require maintenance of appropriate humidity during drying to produce the desired crystal form. This is true of the following case study, which represents an example where humidification during drying can be employed to accelerate desolvation of the crystal form originating from the crystallization.
This case study describes a readily encountered case of crystal form control during API drying. The crystal form generated by the crystallization and isolated by filtration is a mixed solvate (form B) containing both water and methanol. During drying the methanol level must be reduced below the ICH limit, and the crystal must be transformed to the desired hydrate (form A) using humidified nitrogen.
Crystal forms A and B are isostructural, exhibiting similar XRPD patterns. Drying studies employing variable relative humidity (RH) indicated that complete desolvation of the mixed solvate results in a desolvate crystal form (form C), which can be converted to the desired form A upon exposure to appropriate RH. Based on a fundamental understanding of crystal form conversions, the drying to produce the desired crystal form can be achieved via two different approaches. The first approach is a two‐stage serial drying process involving removal of methanol using vacuum drying assisted by dry nitrogen sweep followed by hydration using humidified nitrogen. The second approach is a single‐stage parallel drying process involving concomitant removal of methanol with hydration using vacuum drying assisted by humidified nitrogen.
In the two‐stage serial drying process (Figure 37.10), the wet cake is first dried using dry nitrogen to reduce the residual solvent level below the ICH limit. Appropriate vacuum drying can be done at the elevated temperature dictated by thermal stability considerations to accelerate drying kinetics. This results in crystal form transformation from the mixed solvate to desolvate form C. In the second stage, the crystals are hydrated using humidified nitrogen to obtain the desired hydrate crystal form as judged by conformity testing of the XRPD pattern against the reference form A crystal pattern. The minimum RH required for crystal form conversion from desolvate form C to hydrate form A at a given temperature can be determined based on the DVS isotherm confirmed by variable RH XRPD studies. Figure 37.11 depicts the DVS isotherms at two different temperatures. The hydration stage can be split in two parts. In the first part, higher RH (e.g. 50%) and temperature are used to increase the driving force and diffusivity to accelerate hydration of the crystals to the target water content corresponding to the hydrate. In the second part, a lower RH (e.g. 30%) is used at the dryer offload temperature (which is less than the drying temperature). Since the equilibrium water content of the crystals at a given RH decreases with temperature, this water equilibration should be carried out at the dryer offload temperature.

FIGURE 37.10 Schematic of API crystal form conversion and two‐stage serial drying process.

FIGURE 37.11 Dynamic vapor sorption isotherms at (a) 25 and (b) 60 °C.
Alternatively, the wet cake can be dried with humidified nitrogen throughout the drying process as shown schematically in Figure 37.12. The removal of methanol below the ICH limit is achieved while preserving the crystal hydrate structure. The kinetics of methanol removal from the crystal lattice is facilitated by favorable activity gradients. Humidified nitrogen provides higher activity of water in the gas phase as compared with the solid phase; the opposite applies for the methanol. The resulting activity gradients accelerate the diffusion of water molecules into the crystal lattice while providing the way for methanol molecules to diffuse out of the crystal lattice. At a given temperature, the equilibrium water content increases as the RH is increased from the minimum RH required to stabilize the hydrate to the upper practical limit. The upper practical RH limit is designed in light of the following considerations:
- The dew point temperature of the humidified nitrogen should always be lower than any surface temperature that comes in contact with the humidified nitrogen stream. Note that the wet cake temperature in an AFD can be significantly lower than the jacket temperature.
- Apart from thermal stability considerations, the upper temperature of the humidified nitrogen stream is also governed by the capability of the humidifier and the control of water vapor condensation on the product. Higher temperature along with the higher RH will need higher water vaporization from the humidifier. It will also exhibit higher dew point leading to higher probability of condensation of water that, in turn, can affect the product physical properties adversely.

FIGURE 37.12 Schematic of the API crystal form conversion in single‐stage parallel drying process.
While higher temperature and RH accelerate removal of methanol, the equilibrium water content can also drop at higher temperature; this will require humidification at lower temperature and higher RH.
In the parallel approach, a high RH (e.g. 90%) can be used initially to achieve rapid removal of methanol followed by a subsequent RH reduction to achieve the target hydrate water level. A significant dryer headspace pressure (e.g. 300 mm HgA) and a nitrogen superficial velocity of 0.2 m/min are effective.
Drying by the series approach can be made time efficient as compared with the parallel drying process. However, the impact of each of the processes on crystal surface should be considered. Crystal form transformation often results in surface defects that make the particles weaker and more prone to breakage or attrition in an AFD. The time‐efficient serial drying process can cause such damage. Figure 37.13 shows high magnification laser microscopic images of particles produced by the two different drying approaches. It clearly depicts the surface damage and defects resulting from form conversion to the desolvate followed by conversion to the hydrate as compared with the smoother particle surfaces produced by humidified drying wherein the isostructural crystal lattice is preserved.

FIGURE 37.13 Differences in crystal surfaces resulting from different drying approaches. (a) Two‐stage series drying process. (b) Single‐stage parallel drying process.
Dryer humidification can be accomplished using a commercially available automated humidification unit. Pressurized water supplied to the unit is evaporated. Nitrogen is also supplied to the unit and flows through a heater; the heated N2 is combined with the water vapor, and the stream's temperature and humidity are measured and controlled. The humidified nitrogen then flows from the unit through insulated or heat traced piping and a bubble trap to an inlet port on the top of the AFD. The AFD headspace humidity is also measured.
In summary, the optimal drying protocol for crystal form control must be designed by carefully considering multiple interacting parameters and the desired product physical properties.
37.5 DISTILLATIVE DRYING IN AN AGITATED FILTER DRYER
In an antisolvent‐based crystallization, the compound has poor solubility in the antisolvent but may have moderate to high solubility in other crystallization solvents. The presence of these solvents during the drying process can lead to local regions of high solubility, which, upon agitation or heated drying, leads to bridging of particles to form agglomerates. Multiple antisolvent washes (displacement and slurry) are usually applied to efficiently remove these crystallization solvents. However, these washes are only able to remove the unbound surface solvents and not the solvents that are part of the crystal lattice (e.g. hydrates and solvates). The following case study presents an example of the use of slurry distillation to remove volatile unbound and bound solvents from the AFD and hence significantly reduce the extent of agglomerate formation during the later stages of drying. Particle agglomeration is a commonly encountered problem in APIs isolated from AFDs; agglomerates can form via a multitude of mechanisms, for instance, induced by shear and agitation of wet cake or heat.
In this case study, the crystallization solvent system yields API with an acetonitrile solvate crystal form. The dual solvent system consists of acetonitrile, which is a crystallization solvent, and dibutyl ether (DBE), which is the antisolvent. Following multiple antisolvent washes of the wet cake in the AFD, residual acetonitrile could not be removed to a level less than the critical solvent composition for formation of the mono‐solvate. The use of heated, prolonged slurry, or antisolvent washes in large excess was unsuccessful at removing acetonitrile from the crystal lattice. In the nominal process, after washing the wet cake with the antisolvent, an extended blowdown of the filter cake was completed to remove free solvent. Undesirable agglomerates formed upon cake agitation if the level of acetonitrile was not sufficiently reduced by the blowdown (Figure 37.14). The time required to blow the wet cake to remove acetonitrile to a sufficiently low level to minimize or avoid agglomerate formation significantly increased the process cycle time.

FIGURE 37.14 Typical agglomerates formed in the absence of the distillation; primary particles were isolated through implementation of distillation in the AFD.
In order to remove acetonitrile from the wet cake, a chase distillation was employed in the AFD. Acetonitrile has a sufficiently lower boiling point than DBE, and therefore, DBE was utilized to chase‐distill the contents of the AFD. Implementation of the chase distillation reduced the amount of acetonitrile by greater than 90% versus the API. The removal of acetonitrile reduced potential agglomeration of the API during drying.
A schematic showing the proposed mechanism for solvent removal is detailed in Figure 37.15. Following slurry and displacement washes, acetonitrile remains as it is entrapped in the API crystal lattice. In the presence of an excess of the antisolvent and heat, acetonitrile in the bulk or liquors is removed via distillation. As acetonitrile is removed from the bulk, additional acetonitrile that has diffused within the crystal to the crystal surface moves into the bulk. Continuous agitation of the slurry aids mass transfer from the crystal surface into the bulk as well as through the slurry bed height to facilitate distillation. This process continues until the level of acetonitrile is significantly reduced.

FIGURE 37.15 Schematic of the process for removing solvent within crystals.
The distillation is performed by charging approximately 3 L DBE/kg API to the AFD. The distillation is performed using a jacket temperature of 65 °C and a headspace pressure of approximately 0.1 barA and with continuous agitation in which the blade is moved up and down. A slow flow of nitrogen is applied to the headspace to improve convection of vapor from the AFD to the overhead condenser/vacuum pump. Additional DBE (~5 volumes) at 50 °C is charged to the AFD in shots to maintain slurry consistency. Distillation is terminated after an in‐process sample taken without breaking vacuum using a special slurry sampler indicates an acceptable level of acetonitrile relative to API.
Several parameters play a key role in implementing distillation in the AFD. The most important distillation parameter to optimize is agitation of the slurry. As the process is mass transfer limited by the diffusion of acetonitrile through the boundary layer of the crystal to the bulk as well as the movement of acetonitrile throughout the bed height, continuous and elevated agitation decreases the process cycle time. It is important to ensure the agitation applied does not lead to particle attrition. It may be necessary to add additional antisolvent to chase‐distill acetonitrile, in which case the consistency of the slurry must be sufficiently liquid‐like both to enable mass transfer of acetonitrile through the bed and to avoid particle agglomeration. Preheating the antisolvent prior to addition and adding the antisolvent without breaking vacuum both aid in optimizing the process on scale.
In summary, when traditional methods for removal of crystallization solvents, such as displacement or slurry washes (with or without the use of heat), do not sufficiently remove the crystallization solvent from the wet cake, a slurry distillation can be implemented in the AFD. In this case study, distillation of the acetonitrile crystallization solvent successfully led to isolation of non‐agglomerated API.
37.6 CONCLUDING REMARKS
These drying case studies illustrate the importance of developing an appropriate level of understanding of the drying process to fit the purpose. Early‐stage compounds with relatively straightforward drying behavior require less development than complicated late‐stage compounds that exhibit slow drying or are susceptible to attrition, agglomeration, or form change. Analysis performed during early stages of development may be limited by availability of a sufficient quantity of material for testing. Later‐stage studies are facilitated by increased availability of compound resulting from the increase in process equipment size. Appropriate lab‐ and pilot‐scale studies should be performed to identify the acceptable design space during drying development and process transfer to alternate equipment. This can be constrained by incomplete understanding of material properties, challenges in the calculation of temperature and solvent gradients within a dryer, and the limited capability of analytical tools used to monitor drying.
ACKNOWLEDGMENTS
John Gaertner, Nandkishor Nere, James Marek, Shailendra Bordawekar, Laurie Mlinar, Moiz Diwan, and Lei Cao are employees of AbbVie. The design, study, and financial support were provided by AbbVie. AbbVie participated in the interpretation of data, review, and approval of the publication.
REFERENCES
- 1. Tsotsas, E. and Schlunder, E.U. (1987). Vacuum contact drying of mechanically agitated beds: the influence of hygroscopic behavior on drying rate curve. Chem Eng Process 21: 199–208.
- 2. Nere, N.K., Allen, K.C., Marek, J.C., and Bordawekar, S.V. (2012). Drying process optimization for an API solvate using heat transfer model of an agitated filter dryer. J Pharm Sci 101: 3886–3895.
- 3. Hoekstra, L., Vonk, P., and Hulshof, L.A. (2006). Modeling the scale‐up of contact drying processes. Org Process Res Dev 10: 409–416.