
Energy Sources
Alireza Khaligh University of Maryland at College Park, College Park, MD, United States
Omer C. Onar Oak Ridge National Laboratory, Oak Ridge, TN, United States
Abstract
In modern societies, development level and economic well-being of a society are directly measured by energy generation and consumption. Energy plays an important role in the economic health of a country that is reflected by the gross national product (GNP). The per capita GNP of a country is correlated to the per capita energy consumption. There is a steady demand to increase the energy generation capacity all over the world since the global energy consumption is rising. The main reasons are the technological developments, industrial revolution, and increase in population.
Keywords
Thermoelectric energy; Hydroelectric energy; Solar energy; Wind energy; Ocean energy; Geothermal energy; Nuclear energy; Fuel cells
23.1 Introduction
In modern societies, development level and economic well-being of a society are directly measured by energy generation and consumption. Energy plays an important role in the economic health of a country that is reflected by the gross national product (GNP). The per capita GNP of a country is correlated to the per capita energy consumption. There is a steady demand to increase the energy generation capacity all over the world since the global energy consumption is rising. The main reasons are the technological developments, industrial revolution, and increase in population. In a modern and industrialized community, energy is used in every single human activity. Some major examples are the following:
• Household applications such as heating, cooking, lighting, and air conditioning
• Transportation—passenger cars, buses, trains, trucks, and aircrafts
• Manufacturing heat and electricity as well as user end or industrial products
• Irrigation and fertilizing in agricultural organizations
The worldwide energy consumption has been growing steadily and rapidly right after the industrial revolution. Today's global energy consumption has reached more than 500 EJ. This amount of energy is consumed with an hourly rate of 15 TW [1]. Global energy consumption of 1900 was 0.7 TW. The United States consumes the greatest amount of energy per capita worldwide. The amount of energy consumed in the United States was 105 EJ or 29,000 TWh in 2005, with equivalent rate of 3.3 TW [2,3]. If the hourly consumed power is 3.3 TW, 1 year of consumption corresponds to 29,000 TWh, by 3.3 TW×24 h×365 days. Between 1980 and 2004, the worldwide energy consumption annual growth rate was 2%. The total consumption in 2004 is given in Table 23.1 according to the US Energy Information Administration [1]. The estimated 15 TW total global consumption is mainly generated from the fossil fuels such as coal, oil, and gas.
Table 23.1
Total energy consumption
| Source type | Average power (TW) | Energy per year (EJ) |
| Oil | 5.6 | 180 |
| Coal | 3.8 | 110 |
| Gas | 3.5 | 120 |
| Hydroelectric | 0.9 | 30 |
| Nuclear | 0.9 | 30 |
| Wind, solar, wood, geothermal | 0.13 | 4 |
| Total | 15 | 471 |
This 15 TW of total consumption is shared among several sectors. Around 37% of the total 15 TW is consumed by industrial sectors such as manufacturing, mining, construction, and agriculture. Twenty percent of the total consumption is by the personal and commercial transportation. Residential consumption such as residential lighting, heating, and household appliances corresponds to 11% of the total. Consequently, commercial lighting, heating, cooling, and water provision and sewing services consume 5% of the total [4]. The other 27% of world's energy is lost in the energy generation and transmission stages. The overall energy consumption percentages by sector are shown in Fig. 23.1.

According to Fig. 23.1, the generation and transmission losses are considerably high. In order to generate 2 TW of electric power, approximately 5 TW of power is required. This is due to the fact that efficiency of a typical power plant is around 38% [5]. Fig. 23.1 also imposes that more than a quarter of the produced energy is lost in low efficient conventional energy conversion systems and transmission lines. This issue encourages the increased focus on high efficient renewable energy systems, which may also reduce or eliminate the transmission losses if they are built as distributed energy generation units. In comparison with the efficiency of conventional power plants, new generation of power plants using gas turbines or microturbines may reach a substantially higher efficiency of 55%; however, they still rely on another fossil fuel, which is natural gas [6].
After the invention of steam engines, coal began to be the main source of energy in the eighteenth and nineteenth centuries. Since automobiles were invented and electricity usage became more common, coal left its popularity to the oil during the twentieth century. From 1920 to 1973, oil was the main resource fueling the industry and transportation, and its price steadily dropped during these years. Oil kept its expansiveness until the 1970s. In the oil crises of 1973 and 1979, price per barrel boosted from 5 to $45, and oil was not the best and most common source of energy production anymore [7]. From these dates, coal and nuclear became the sources for electric power generation. In those years, energy conversation and increasing the energy efficiency gained importance. However, the use of fossil fuels has continued over the last 30 years, and their contribution to overall energy production has increased. During the last 3 years, coal has become the fastest growing fossil fuel, since it has large remaining reserves [7]. On the other hand, renewable energy sources have gained interest due to the depletion of fossil fuels, followed by high oil prices, and climate change concerns related to the carbon emissions. Therefore, government support on development, deployment, incentives, and commercialization of renewable energies are ever increasing. For instance, in March 2007, it is agreed by the European Union members that at least 20% of their nations' energy should be produced from renewable sources by 2020. This is also a part of environmental concerns such as global warming [8] and building a sustainable energy economy by reducing the nations' dependence on imported fossil fuels. However, although there is a large availability of renewable sources, their contribution to globally consumed energy is relatively poor.
In developed countries such as Germany and Japan, the national gross product is 6 kW per person and 11.4 kW per person in the United States. Bangladesh has a low consumption with 0.2 kW per person, while it is around 0.7 kW per person for a developing country such as India. Twenty-five percent of the overall world's energy is consumed by the United States, while its share of global energy generation is 22% [4]. Energy consumption in the United States is shared by four broad sectors according to the US Department of Energy. Similar to the world's energy consumption, the largest user is the industrial sector, currently consuming 33% of the total energy. Next largest amount of energy is consumed for transportation followed by residential and commercial users. Energy consumption shares of the United States for four major energy consumption sectors (industrial, transportation, residential, and commercial) are demonstrated in Table 23.2 [4,9,10].
Table 23.2
US nationwide energy consumption sectors
| Sector | Major use shares |
| Industrial: This sector mainly consumes 33% of total energy for the manufacturing, producing, and processing goods such as chemical refining, metal production, paper, and cement production | 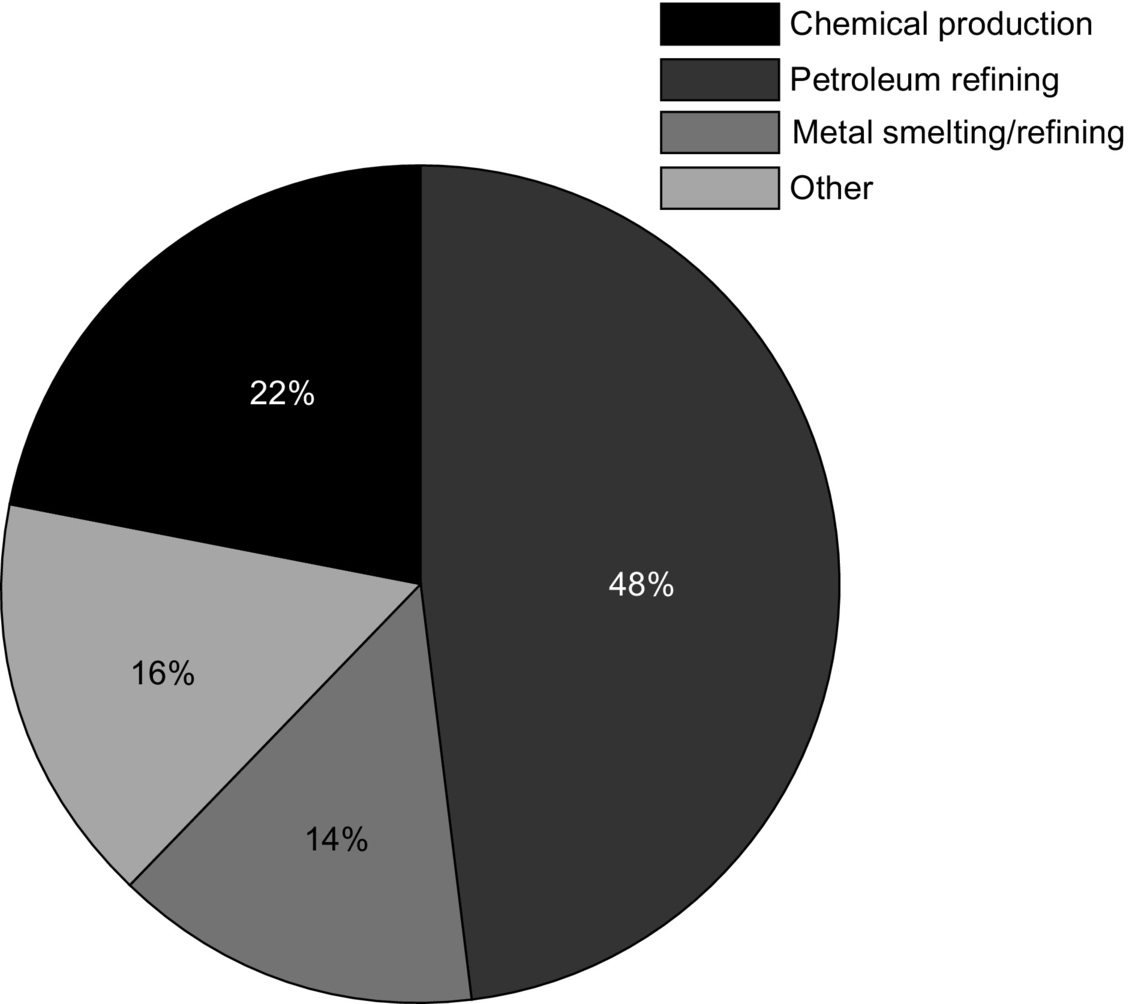 |
| Transportation: Twenty-eight percent of the total energy consumption is shared by this sector for land, sea, and air vehicles transporting people and goods | 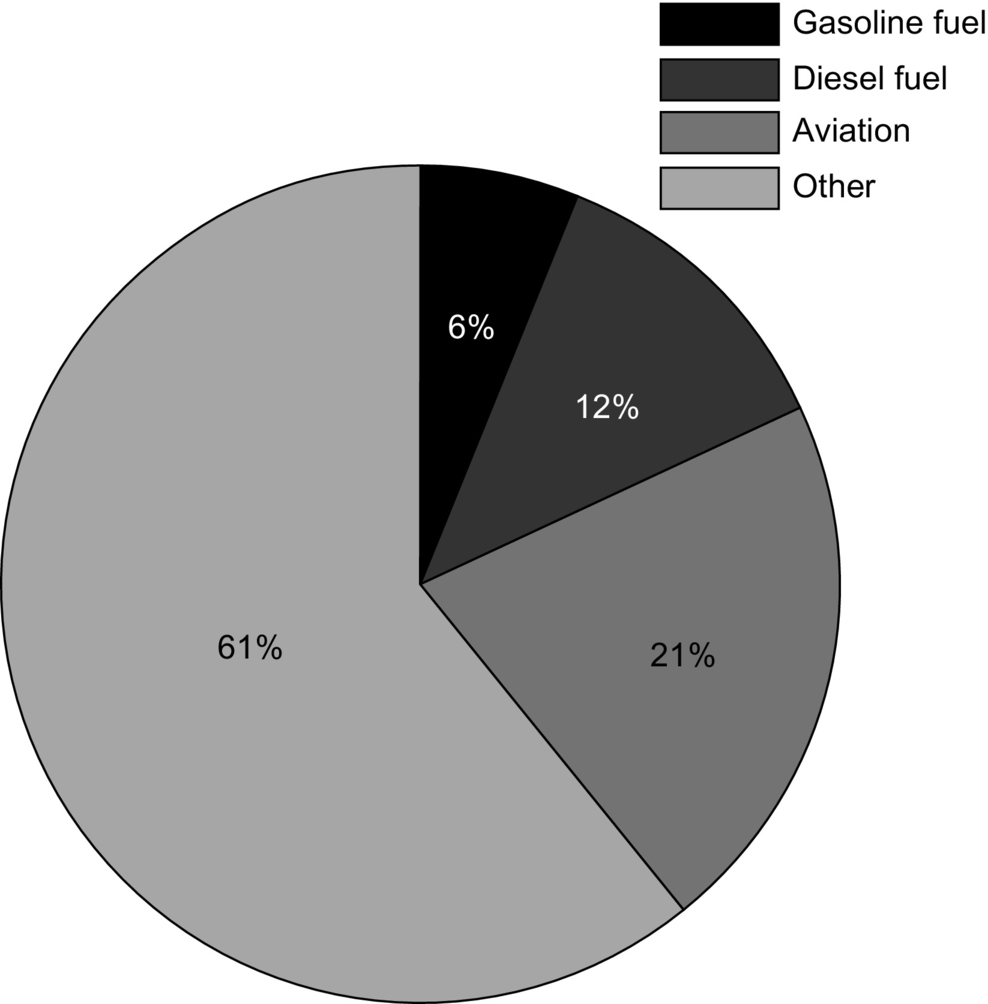 |
| Residential: This sector consumes 21% of the total energy for household power requirements |  |
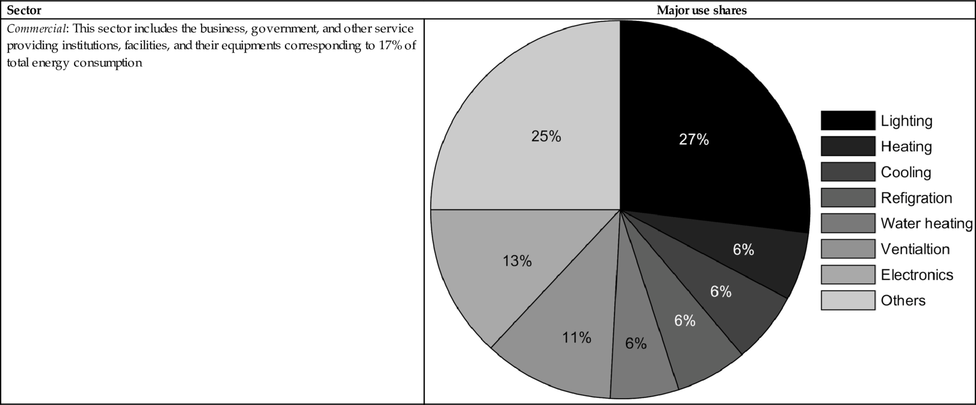
| Commercial: This sector includes the business, government, and other service providing institutions, facilities, and their equipments corresponding to 17% of total energy consumption |  |

Most of the electric power generation of the United States is provided by conventional thermal power plants. Most of these power plants are operated by coal. However, from 1990 to 2000, the number of natural gas or other types of gas-operated power plants was increased significantly. 270 GW of new gas-operated thermoelectric power plants were built in United States from 1992 to 2005. Only 14 GW capacity belonged to new nuclear and coal-fired power plants, with 2.315 GW of this amount being nuclear, while the remaining is the coal-fired power plants [11]. The significant shift to the gas-operated power plants is due to the deregulation, political, and economic factors; however, nuclear and coal are considerably capital-intensive. On the other hand, there is a great potential for renewable energies in the United States. For instance, the US wind power capacity is close to 20 GW, which is sufficient to supply power to 4.5 million typical households [12]. Although there is a great availability of the solar power, solar power percentage of total capacity is only 0.04% retrieved by plants that are currently in operation, including the new Nevada Solar One plant with 64 MW capacity and the largest solar thermal power station in the Mojave Desert with a total generation capacity of 354 MW, which is the world's largest solar plant [13].
Electric power generation in the United States for 2006 is summarized in Table 23.3 in terms of total capacity (MW), annual production (billion kWh), and units in operation [14].
Table 23.3
2006 Energy generation in the United States
| Source type | Total capacity (on nameplate) (MW) | Annual production (billions kWh) | Units in operation |
| Coal-fired boiler power plants | 333,115 | 1995 | 1460 |
| Combined cycle natural gas plants | 216,269 | 505 | 1686 |
| Combustion turbine generators | 155,227 | 147 | 2882 |
| Nuclear power plants | 105,584 | 787 | 104 |
| Natural-gas-fueled boiler plants | 97,632 | 159 | 776 |
| Hydroelectric power plants | 96,988 | 282 | 4138 |
| Oil-fired boiler power plants | 34,975 | 7.8 | 327 |
| Wind power | 11,603 | 30.3 | 341 |
| Diesel generators | 8563 | 13.8 | 4514 |
| Biomass | 6256 | 53.5 | 270 |
| Geothermal | 3170 | 13.5 | 215 |
| Incinerators | 2671 | 12.3 | 96 |
| Petroleum-coke-fueled power plants | 1754 | 46.4 | 31 |
| Fuel oil power plants | 956 | 8.5 | 13 |
| Solar energy | 411 | 2.1 | 31 |

According to Table 23.3, it is seen that the most contributing power source to the US energy production is the coal-fired thermoelectric power plants. Although the established power capacity of the nuclear power plants is less than that of the combined cycle natural gas plants and combustion turbine generators, nuclear power plants are the second greatest source in annual energy production. This is due to the higher efficiency of these plants and under-capacity operation of natural gas power plants and combustion turbine generators. Other than the nuclear power plants and fossil-fueled power plants, hydroelectric power plants have a significant contribution to the annual production although they require a relatively large number of units in operation. This is mainly due to the relatively lower power capacity of the hydroelectric power plants. Renewable energy sources of wind and solar still have insignificant number of units in operation, and their annual contribution is considerably insignificant to the nation's total energy production although the available potential capacity of these sources are really high.
The energy production rates of energy sources are given in Fig. 23.2 [14].

The energy demand of the world is rapidly and steadily increasing. In 2007, the electric power demand of the United States was 783 GW in summer and 640 GW in the winter. It is projected by the North American Electric Reliability Corporation (NERC) that the electric power demand of the United States will increase to 925 GW for summer and 756 GW winter in 2017 [15]. Therefore, environmental concerns on global warming and sustainability along with the political considerations on the supplies' security will shift the overall energy consumption away from the fossil fuels. Nowadays, many researchers and politicians call for immediate actions for long-term sustainable energy solutions. Based on a growing consensus, peak oil may be reached in the near future, and this will result in severe oil price increases [16]. If a long-term solution cannot be developed prior to the peak oil scenario, the world economy may face a grinding halt.
This chapter focuses on naturally available energy sources and deals with the efficient utilization of these sources. Moreover, renewable and sustainable energy generation techniques are discussed in this chapter. In addition, the operating principles, efficient utilization, and grid-connection issues as well as power electronic interfaces for these renewable energy sources are demonstrated. While inventing new methodologies to maximize the efficient usage of traditional sources such as coal, oil, and natural gas, it is of great importance to develop new technologies to produce emerging sources of energy from renewables.
Consequently, by efficient use of conventional energy sources and utilizing alternate sources of energy, the reserves of the conventional energy resources can last for longer, global warming can be slowed down, and environmental pollution can be reduced [17].
23.2 Available Energy Sources
Primary sources of energy are fossil fuels such as oil, natural gas, coal, and other sources such as nuclear, solar, wind, hydroelectricity, or potential sources available in oceans. The energy that has not been converted or transformed into another form is known as primary energy source. More convenient form of energy such as electric energy is obtained by transforming primary energies in energy conversion processes. These converted forms are called as secondary energy sources.
23.2.1 Coal
Coal is the most abundant fossil fuel of the world with around 909 billion tons of reserves. It is expected to sustain for the next 155 years at the current production rate [4]. Coal is the fastest growing fossil fuel to meet the energy demand of the global community. However, coal is the dirtiest energy source with numerous pollutants and high emissions [11].
23.2.2 Oil
It is estimated that there is 57 ZJ of oil reserves on Earth. This amount includes the available but not necessarily recoverable reserves. Other estimates vary from 8 ZJ including currently proved and recoverable reserves to a maximum of 110 ZJ including nonrecoverable reserves [18]. World's current oil consumption is 85 mbd, and it is estimated that the peak consumption will be 93 mbd in 2020. Oil and its chemical derivatives are mainly used for transportation and electric power generation.
23.2.3 Natural gas
There is not any certain number indicating world's available natural gas reserves. However, according to the US Energy Information Administration, there are 237,726 billion cubic feet (cu-ft) of dry natural gas reserves in the United States, while the liquid natural gas reserves are of 9143 million barrels [19]. Natural gas has become one of the major sources of electric power generation through the steam turbines and gas turbines due to their higher efficiency. Natural gas is cleaner than any other fossil fuels and produces fewer pollutants per generated unit energy. Burning natural gas produces about 30% less carbon dioxide than burning petroleum and about 45% less than burning coal for an equivalent amount of heat [20]. Some of the natural gas power plants are operated in combined cycle mode to obtain higher efficiencies. In this operation, gas turbines are combined with the steam turbines in order to get the benefit of waste heat using steam turbines.
23.2.4 Hydropower
Hydroelectric power plants supplied 16.4% of the world's electric power in 2005 [21]. The hydroelectric power is not an effective solution, since most of the potential sites are already in use or they are not feasible to be exploited due to environmental and economical concerns. In addition, the life span of hydroelectric power plants is limited, due to soil erosion and accumulation. Because of these concerns, the construction of large hydroelectric power plants has stagnated. The new trend all over the world has been building smaller hydro power units called as microhydro since they can be a part of distributed generation, opening up many locations for power generation and they have less or negligible environmental effects [22,23]. On the other hand, hydroelectric power plants have no emissions since no fuel is burnt. Hence, hydropower is a clean energy source in comparison with fossil-fuel-based energy sources. In 2005, the worldwide hydroelectricity consumption reached 816 GW with 66 GW of small hydro plants and 750 GW of large plants [24].
23.2.5 Nuclear Power
In 2006, 16% of the world's total electric power production was supplied by nuclear power that is accounted 2658 TWh [11,25,26]. Total power capacity of the established nuclear power plants was about 372 GW by November 2007 [25]. The remaining uranium resources are estimated to be 2500 ZJ by the International Atomic Energy Agency [27]. Since there is plenty of available sources and developed technology, the contribution of nuclear power to the future's energy demand is not limited. However, there are political and environmental constraints, which restrict the growth of nuclear power plants. The cost of generating nuclear power is approximately equal to that of the coal power. Moreover, nuclear power has zero pollutant emissions such as CO, CO2, NO, and SO2.
23.2.6 Solar
Earth receives around 120,000 TW of solar energy resource per year. As an energy source, less than 0.02% of available solar resources are capable of entirely replacing all nuclear power and fossil fuels [28,29]. Although it is still expensive in comparison with conventional energy conversion techniques, the fastest growing energy source in 2007 were grid-connected photovoltaic (PV) systems. The total installed capacity reached to 8.7 GW by increasing all PV installations by 83% in 2007 [30]. High cost of manufacturing solar cells, reliance on weather conditions, storage, and grid-connection problems are the major barriers of further development of solar generation.
23.2.7 Wind
Wind is one of the greatest available potential energy sources. The available wind energy is estimated to be from 300 [31] to 870 TW [32]. Only 5% of the available energy is capable of supplying the current worldwide energy demands. However, due to fewer obstacles, most of this wind energy is available on the open oceans on which construction of wind turbines and energy transmission is relatively difficult and expensive. From 2006 to 2007, the installed wind turbines' capacity was increased by 27% to total of 94 GW according to the Global Wind Energy Council [33]. However, the actual generated power is less than the nominal capacity since the nominal capacity represents the peak output, and the actual output is around 40% of the nominal capacity due to efficiency issues and lower wind speeds [34].
23.2.8 Ocean
Energy of ocean can be categorized in three major methods: ocean wave power, ocean tidal power, and ocean thermal power. All of these three methods can be installed as onshore or offshore applications.
Wave energy harvesting is a concept that the kinetic energy of waves of the deep water or waves hitting the shores is captured and converted to electric energy. The kinetic energy of waves is converted to electric energy using several different methods. It is estimated that the deep-water wave power resources vary from 1 to 10 TW [35], while the total power of the waves hitting the shores may add an additional power of 3 TW [31,36]. Capturing this entire amount of power is not practical and feasible. It is estimated that 2 TW of this power can be usefully captured [37,38].
Ocean tides occur due to the tidal forces of the moon and the sun, in combination with the earth's rotation. Tidal power has a great potential for future energy generation since it is cleaner in comparison with fossil fuels and it is more predictable in comparison with other renewable energies such as wind and solar. The kinetic energy of the moving water can be captured by tidal stream or tidal current turbines. Alternatively, the barrages can be used to capture the potential energy created due to the height difference between the low and high tides. Various methods can be employed for the realization of these concepts. The total estimated tidal power potential is 3.7 TW [39]. However, only around 0.8 TW of this amount is available due to the dissipation of tidal fluctuations. The amount of energy generated from ocean tides was 0.3 GW at the end of 2005 [40], which is much less than the available potential.
The other way of generating power from the oceans is the ocean thermal energy conversion (OTEC). In this method, the temperature difference between the warm shallow water and the cold deep water is used to drive a heat engine, which in turn drives an electric generator [41]. The efficiency of OTEC power plants is relatively low [41,42] due to the power requirements of the auxiliary OTEC devices such as water intake and discharge pumps. Moreover, this technique is expensive since the efficiency is low and greater capacities of installations are required to produce reasonable amounts of energy [43].
23.2.9 Hydrogen
Hydrogen is an energy carrier [44,45]; in other words, it is an intermediate medium for energy storage and carriage. Hydrogen is the most abundant element of the Earth (approximately corresponding 75% of the elemental mass of the universe) [46], and it is the simplest and lightest element of all chemical elements with an atomic number of 1. Hydrogen exists in nature in combination with other elements such as carbon and nitrogen in fossil fuels, biological materials, or with oxygen in water [47]. Hydrogen can be combusted in air, or it can react with oxygen using fuel cells to produce energy. The resultant combustion energy or electric energy does not cause any CO or CO2 emissions. However, splitting hydrogen from the combination of other elements require additional energy. The main source of global hydrogen production is natural gas (48%). Other sources of hydrogen production are oil (30%), coal (18%), and water electrolysis (4%) [48]. Currently, most of the hydrogen is produced from gas derivatives such as natural gas, ethane, methane, ethanol, or methanol. Hydrogen production from fossil fuels, known as reformation, contains several pollutant emissions. Although electrolysis is clean, this method has various challenges and still has very poor efficiencies and high production costs. Biological or fermentative reactions can be another method of hydrogen production; however, this method has some obstacles such as the amount of products is not significant [48,49]. Using hydrogen in hydrogen combustion engines is several percent more efficient than the conventional internal combustion engines. On the other hand, using hydrogen in the fuel cells is twice or three times more efficient than that of the internal combustion engines. However, there are several challenges for the commercialization of fuel cells such as the size, weight, cost, and durability. Other major technical difficulties related to hydrogen are the production, delivery, and storage issues.
23.2.10 Geothermal
Geothermal energy is the utilization of heat stored in the inner layers of the earth or collecting the absorbed heat derived from underground. The geothermal energy production has reached to 37.3 GW at the end of 2005 [24]. 9.3 GW of this amount is used for electric power generation, while the rest of it is used for residential or commercial heating purposes. Enhanced geothermal systems (EGS) is a technique that extends the potential for the use of geothermal energy. In this technique, the heat is extracted by building subsurface fractures to which water can be added through injection wells. Through this technique, the electric generation capacity can reach to about 138 GW [50]. The overall EGS capacity of the world is calculated to be more than 13 YJ, where 200 ZJ of this amount is extractable. By the technological improvements and investments, this amount is projected to increase over 2 YJ [51]. However, in contrary to this enormous potential, geothermal supplies less than 1% of the world's energy demand as of 2008 [21]. Geothermal energy has high availability (average daily availabilities more than 90%) and in fact has no pollutant emissions since it does not require any fuel or combustion. Furthermore, geothermal power stations do not rely on weather conditions. In addition, it is considered to be a sustainable source of energy since the extracted heat is relatively small in comparison with the heat reservoir's size. In other words, geothermal heat energy is replenished from deeper layers of the earth; therefore, it is not exhaustible.
23.2.11 Biomass
Biomass is a fuel that is also called biofuel, and the bioenergy is the energy enclosed in the biomass. Today, biomass has a small contribution to the overall energy supply, although it was the major fuel until the nineteenth century. In 2005, electric power from biomass was about 44 GW, while more than 230 GW biomass power is used for heating [40]. As a sustainable energy source, biomass is a developing industry in many countries such as Brazil, the United States, and Germany. As an alternative to the fossil fuels, biomass production is significantly increasing worldwide. The biodiesel production increased by 85% to 1.03 billion gallons in 2005, and biodiesel became the world's fastest growing renewable source of energy. Bioethanol production was also increased by 8% and reached 8.72 billion gallons during 2005 [40]. Even though it is commonly believed that biomasses may be carbon neutral, their current farming methods cause substantial carbon emissions [52,53].
23.3 Electric Energy Generation Technologies
Electric energy generation is a process where the energy sources or energy potential is converted to electric energy. Energy generation can be done in various techniques. Due to the upcoming emerging challenges in the global energy supply systems, energy from the conventional sources needs more efficiency. In addition, there should be an increase in utilization of energy generation from alternative and renewable energy sources. In the following subsections, the alternative energy sources along with their conversion to electric energy are described.
23.3.1 Thermoelectric Energy
Thermoelectric power plants are mainly coal-fired power stations. In a thermoelectric power plant, coal or other fuels are burnt in order to heat up the water in the boiler. In this system, the high pressurized steam rotates a steam turbine, which is coupled to an electric generator. After the steam passes through the turbine, it is cooled and condensed back to water in the condenser. This is known as Rankine cycle [54]. More than 80% thermal power plants all over the world operate based on this cycle. In the Rankine cycle, there are four processes in which the working fluid's state is changed as shown in Fig. 23.3 [55]. These processes can be described as follows [56,57]:

Process 1–2: When the fluid is condensed and converted to liquid form, the liquid is pumped from low to high pressure. The pumping process requires a small amount of energy.
Process 2–3: The high-pressure liquid that pumped into the boiler is heated at constant pressure until it becomes saturated dry vapor. The boiler is energized by a heat source such as a coal furnace.
Process 3–4: During this process, saturated vapor passes through the steam turbine. The heat energy is converted into mechanical energy. While the steam passes through the turbine, it may somehow get condensed since this process decreases the pressure and temperature of the vapor.
Process 4–1: In this process, the vapor is condensed at a constant pressure and temperature in a condenser. As a result, wet vapor is converted to saturated liquid. The cooler helps keeping the temperature constant as the vapor changes its phase from steam to liquid.
These four processes of the Rankine cycle are shown in Fig. 23.3.
Since coal is the most abundant energy source of the world, coal-fired power plants have been widely used in electric power generation all over the world [58]. Coal is a cheap energy source, and coal-fired power plants have mature technology. Therefore, the generation cost is less, and thermoelectric power plants can be constructed anywhere close to fuel and water supply. Although the consumption sites might be relatively far away from the coal mines or water supplies, fuel and water can be transported to the generation plants. Since the coal has been the backbone of the electric power industry since the late 1800s, approximately 49% of the electric power generated in the world is supplied by coal-fired thermoelectric power plants [59].
In a simple form, the operation of a coal-fired power plant can be similar to Rankine cycle. In this form, the plant consists of a boiler, a steam turbine driving an electric generator, a condenser, and a feedwater pump. Coal is first pulverized and burnt in the steam generation furnaces. The water in the boiler tubes is heated, and steam is generated in this way at high pressures. The steam generation process is composed of three subprocesses that are economizing, boiling, and superheating. In the economizer, the water is heated to a point that is close to the boiling point. Then, the steam is raised in the boiler. Finally, the steam is further heated and dried at the superheater. The steam at its final form is then conveyed to the steam turbine. The mechanical force pushing the turbine blades yields the steam turbine to rotate, which in turn drives the electric generator producing electricity. The cooler steam with lower pressure is released from the turbine. This steam is conveyed to the condenser to be liquefied. This water is pumped back to the steam generator, and the closed loop system is completed [56]. Considering the other auxiliary devices and peripheral components such as cooling tower, coal conveyor, and ash and waste management units, the schematic of a coal-fired thermoelectric power plant can be presented in Fig. 23.4.

The components of the thermoelectric power plant are described in Table 23.4.
Table 23.4
Thermoelectric power plant components
| 1—Coal conveyor | 10—Air intake pipe | 19—Low-pressure turbine |
| 2—Coal hopper | 11—Air preheater | 20—Condenser |
| 3—Pulverization mill | 12—Feed heater | 21—Electric generator |
| 4—Boiler drum | 13—Steam governor | 22—Induced draught fan |
| 5—Ash hopper | 14—High-pressure turbine | 23—Cooling water pump |
| 6—Superheater | 15—Deaerator | 24—Power transformer |
| 7—Forced draught fan | 16—Intermediate-pressure turbine | 25—Cooling tower |
| 8—Reheater | 17—Precipitator | 26—Chimney stack |
| 9—Economizer | 18—Boiler feed pump from condenser | 27—Transmission network |
The operation of the cola-fired power plant begins with the coal conveyor. From an exterior stack, coal is conveyed through a coal hopper to the pulverizing fuel mill where it is grounded and converted to a fine powder. The pulverized coal is mixed with preheated air. The air is taken by an air intake pipe and pumped to be mixed with pulverized coal. This preheated air is supplied by the forced draught fan. In the boiler, where the air-fuel mixture is ignited at high pressure, the generated heat increases the temperature of the water. The water then changes its phase to steam where it flows vertically up the boiler tubes. This steam is passed to the boiler drum where its remaining water content is separated. This dry steam is then passed through a manifold from the drum into the superheater. In the superheater, further pressure and temperature increase; steam reaches about 200 bar and ![]() C. The turbine process of the power plant comprises three stages: high-pressure turbine, intermediate-pressure turbine, and low-pressure turbine. First, the steam passes to the high-pressure turbine through the pipes. Both the manual turbine control and the automatic set-point following can be provided by a steam governor valve. The temperature and the pressure of the steam decrease when it is exhausted from the high-pressure turbine. This steam is returned to the boiler reheater for further use. The reheated steam passes to the intermediate-pressure turbine. The steam released from the intermediate-pressure turbine is passed directly to the low-pressure turbine. Now, the steam is cooler and just above its boiling point. This steam is then condensed in the condenser by contacting thermally with the cold water tubes of the condenser. As a result, the steam is converted back into water, and the condensation causes a vacuum effect inside the condenser chest. The condensed water is prewarmed by the feed heater using the heat of the steam released from the high-pressure turbine and then in the economizer. Then, this prewarmed water is deaerated and passed by a feedwater pump, which completes the closed cycle. The cooling tower cools down the water from the condenser creating an intense and visible plume. Finally, the water is pumped back to the cooling water cycle. The induced draft fan draws the exhaust gas of the boiler. Here, an electrostatic precipitator is used. Finally, this exhaust gas is vented through the chimneys of the power plant.
C. The turbine process of the power plant comprises three stages: high-pressure turbine, intermediate-pressure turbine, and low-pressure turbine. First, the steam passes to the high-pressure turbine through the pipes. Both the manual turbine control and the automatic set-point following can be provided by a steam governor valve. The temperature and the pressure of the steam decrease when it is exhausted from the high-pressure turbine. This steam is returned to the boiler reheater for further use. The reheated steam passes to the intermediate-pressure turbine. The steam released from the intermediate-pressure turbine is passed directly to the low-pressure turbine. Now, the steam is cooler and just above its boiling point. This steam is then condensed in the condenser by contacting thermally with the cold water tubes of the condenser. As a result, the steam is converted back into water, and the condensation causes a vacuum effect inside the condenser chest. The condensed water is prewarmed by the feed heater using the heat of the steam released from the high-pressure turbine and then in the economizer. Then, this prewarmed water is deaerated and passed by a feedwater pump, which completes the closed cycle. The cooling tower cools down the water from the condenser creating an intense and visible plume. Finally, the water is pumped back to the cooling water cycle. The induced draft fan draws the exhaust gas of the boiler. Here, an electrostatic precipitator is used. Finally, this exhaust gas is vented through the chimneys of the power plant.
In the thermoelectric power plants, load-following capability, efficiency, fuel and water management, and emissions are important issues. In addition, the active and reactive outputs of the power plant's generators and frequency and voltage regulations have impact on the power plant operation.
23.3.2 Hydroelectric Energy
Hydroelectric energy is generated by the kinetic and potential energy of flowing or falling water by the effect of gravitational force. Hydroelectric is the most mature and widest utilized form of renewable energies. Hydroelectric energy has approximately 20% contribution to the overall world energy generation [60]. No fuel is burnt at hydroelectric power plants; therefore, they do not have greenhouse gas emissions. The operating cost is relatively low since the water running the plant is supplied free by the nature. It is a renewable source of energy since the rainfall renews and enriches the water reservoirs.
Hydroelectric energy is generally obtained from the potential energy of dammed or reservoired water. When the water falls from a certain height of the reservoir output, it loses its potential energy and gains kinetic energy. The water flow drives a water turbine that is coupled to an electric generator, which in turn generates electricity. This generated energy is a function of the water volume and the difference between the source and outflow of the water [61]. This height difference between the water output and turbine is called as “head.” The potential energy of the water is proportional to the head. In order to generate greater amounts of energy, the head can be increased by running the water for hydraulic turbine through a large and long pipe called as penstock [62]. The cross-sectional view of a hydraulic dam and the hydroelectric power plant components are represented in Fig. 23.5.

In Table 23.5, these components are explained.
Table 23.5
Hydroelectric power plant components
| A—Reservoir | E—Water intake |
| B—Intake | F—Penstock |
| C—Water turbine | G—Transformer and transmission lines |
| D—Electric generator | H—River |
Electric power generation in a hydroelectric power plant can be approximately calculated as [63]:
where P is the generated power (kW), h is the height (m), r is the water flow rate (m3/s), and g is the gravitational acceleration (m/s2). In Eq. (23.1), the term hrg represents the potential energy of the water. ηt and ηg represent the efficiency of the water turbine and the generator, respectively. These efficiency rates are required for the water potential energy conversion into the electric energy.
The other methods of electric generation by hydroelectricity are the pumped storage hydroelectric power plants and run-of-the-river plants. In pumped storage method, the water is pumped into higher elevations by using the excess generation capacity during the periods when electric demand is lower. The water is released back into lower elevations through a turbine when the electric power demand is higher. In this method, water acts as an energy carrier in order to compensate the generation-consumption difference in a commercial device by improving the daily load factor [61–63]. In run-of-the-river plants, water reservoirs are not used, and the kinetic energy of the flowing water through a river is captured using waterwheels.
23.3.3 Solar Energy Conversion and Photo-Voltaic Systems
Solar energy is one of the growing renewable energy sources, which is plentiful and has the greatest availability among other energy sources. The amount of solar energy supplied from the sun to the earth is capable of satisfying the total energy requirements of the earth for 1 year [64]. Furthermore, solar energy does not produce pollutants or harmful by-products; it is free of emissions. Solar energy is applicable to many fields such as vehicular, residential, space, and naval applications.
23.3.3.1 Photovoltaic Effect and Semiconductor Structure of PVs
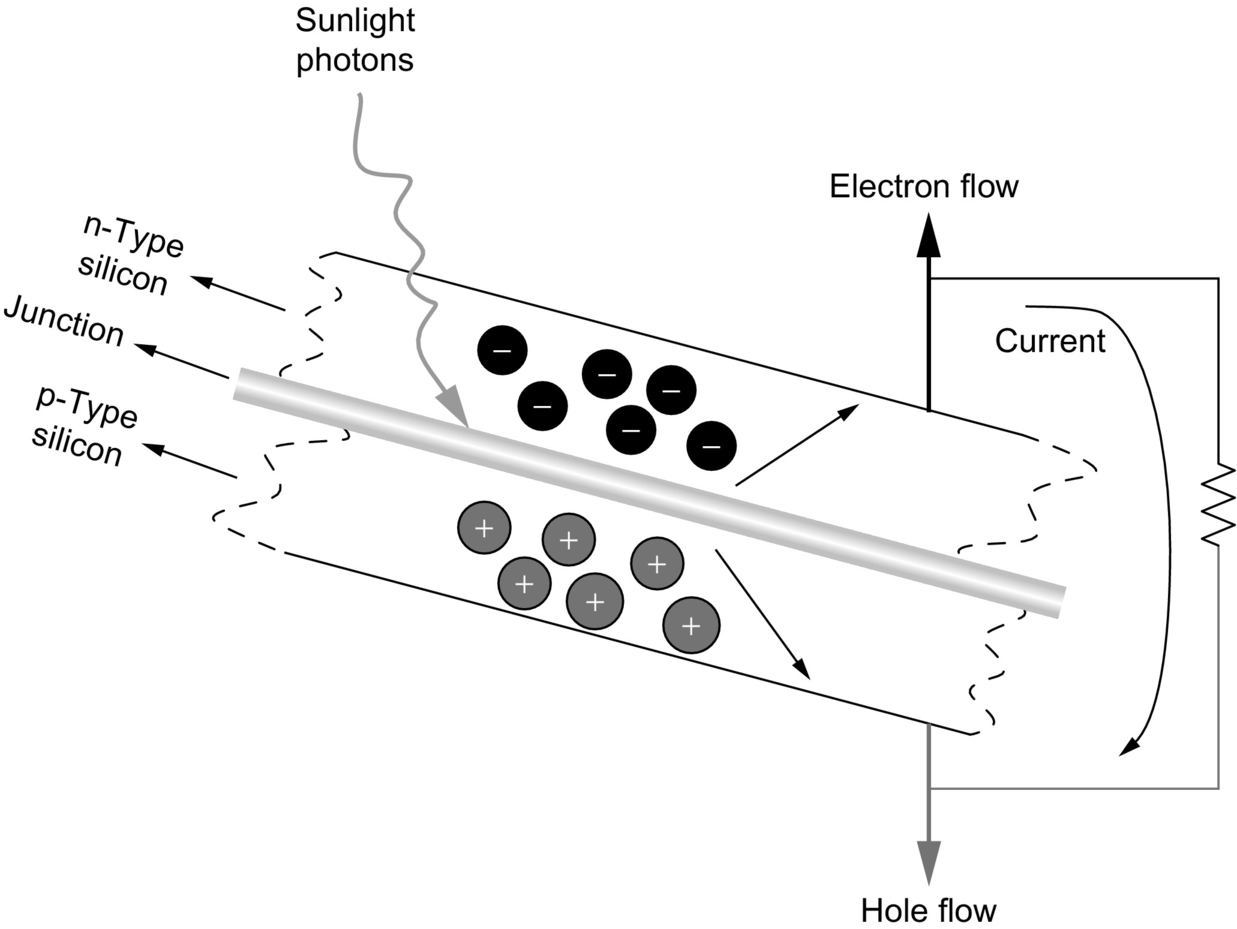
PV effect is known as a physical process in which a PV cell converts the sunlight into electricity. When a PV cell is subject to the sunlight, the absorbed amount of light generates electric energy, while remaining sunlight can be reflected or passed through. The electrons in the atoms of the PV cell are energized by the energy of the absorbed light. With this energy, these electrons move from their normal positions in the semiconductor PV material, and they create an electric flow, that is, electric current through an external electric circuit connected to the PV cell terminals. The built-in electric field that is a specific electric feature of the PV cells provides the voltage potential difference that drives the current through an external load [65]. Two layers of different semiconductor materials are placed in contact with each other in order to induce the built-in electric field within a PV cell. The first layer that is n-type has abundance of electrons, and it is negatively charged. The other layer that is p-type has abundance of holes, and it is positively charged. Since the n-type silicon has excess electrons and p-type silicon has excess holes, contacting these layers together creates a p/n junction at their interface, thereby creating an electric field. In this contact, excess electrons move from the n-type side to the p-type side. As a result, a positive charge is built up along the n-type side of the interface and negative charge along the p-type side. Thus, an electric field is created at the surface where the layers meet, called the p/n junction. This electric field is due to the flow of electrons and holes. This electric field causes the electrons to move from the semiconductor toward the negative surface to carry current. At the same time, the holes move in the opposite direction, toward the positive surface, where they wait for incoming electrons [65]. The basic structure of a p-n junction in a PV cell is illustrated in Fig. 23.6.
23.3.3.2 PV Cell/Module/Array Structures
A PV or solar cell is the basic building block of a PV (or solar-electric) system. An individual PV cell is usually quite small, typically producing about 1 or 2 W of power [66]. PV cells can be connected together to form a larger unit called modules in order to increase the power output of PV cells. Modules can be connected together and form larger units that are called arrays to generate more electric power. The output voltage of a PV system can be boosted by connecting the cells or modules in series. On the other hand, the output current can reach higher values by connecting them in parallel.
23.3.3.3 Active and Passive Solar Energy Systems
Based on the solar tracking capability, solar energy systems can be categorized into two types, passive and active systems [67,68]. In passive solar energy systems, there are not any moving mechanisms for the panels. In this technique, the energy is absorbed and retained, and spaces are designed that naturally circulate air to transfer energy and referencing the position of a building to the sun to enhance energy capture. On the other hand, in active solar energy systems, typically, there are electric and mechanical components such as tracking mechanisms, sensors, motors, pumps, and fans to capture sunlight and process it into usable forms such as heating, lighting, and electricity. The panel positions are controlled in order to maximize exposure to the sun.
23.3.3.4 Components of a Complete Solar Energy System
In Fig. 23.7, the block diagram of a solar energy system is demonstrated. In this system, the sunlight is captured by the PV array. The photodiode or photosensor signals determine the sun-tracking motor positions. This sun-tracking control helps following the daily and seasonal solar position changes to face the sun directly and capture the most available sunlight. A dc/dc converter is employed at the PV panels' output in order to operate at the maximum power point (MPP) based on the current-voltage (I-V) characteristics of the PV array [69]. This dc/dc converter is controlled to operate at the desired current and voltage output of the PV array. A dc/ac inverter is usually connected to the output of this MPPT dc/dc converter in order to feed the ac loads for grid interconnection. A battery pack can be connected to the dc bus of the system to provide extra power that might not be available from the PV module during night and cloudy periods. The battery pack can also store energy when the PV module generates more power than the demanded. A grid connection is also useful to draw/inject power from/to the utility network to take the advantage of excess power or to recharge the batteries using grid power during the peak-off periods of the utility network.

23.3.3.5 I-V Characteristics of Photovoltaic (PV) Systems, PV Models, and Equivalent PV Circuit
PV systems have a special current-voltage characteristic. As more current is drawn from the PV system, the system output voltage decreases. These characteristic curves differ at different solar insulation and temperature conditions; hence, the curves can be obtained by varying the load resistance (varying the output current) and measuring the output voltage for many different current values. I-V curve passes through two points for zero voltage and zero current.
• The short-circuit current (Isc): Isc is the current produced when the positive and negative terminals of the cell are short-circuited, and the voltage between the terminals is zero, which corresponds to zero load resistance.
• The open-circuit voltage (Voc): Voc is the voltage across the positive and negative terminals under open-circuit conditions, when the current is zero, which corresponds to infinite load resistance.
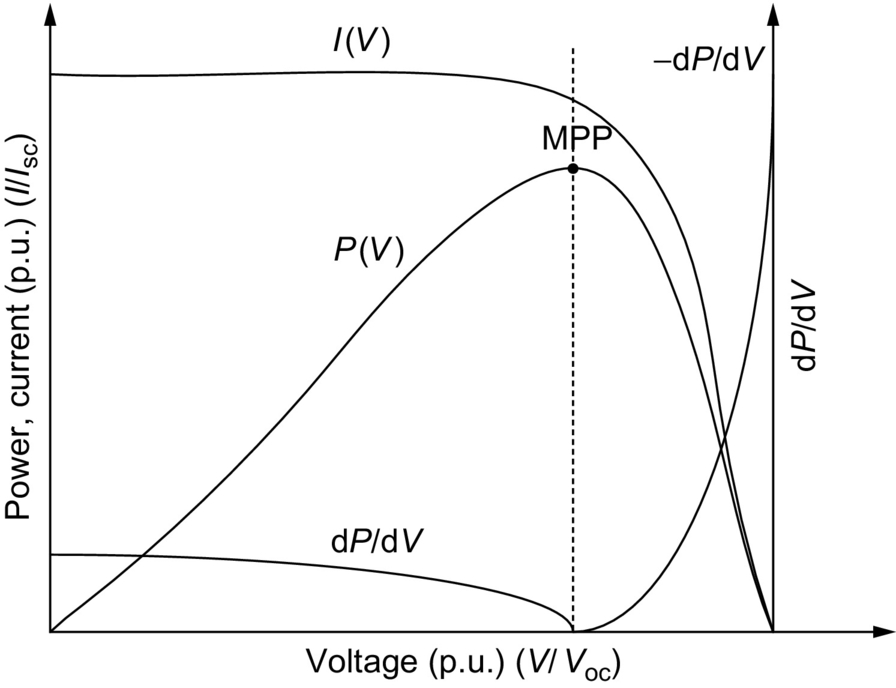
In order to extract maximum power from a PV system, for a constant ambient condition, there is only one current-voltage pair. On the I-V curve, the maximum power point (Pm) occurs when the product of current and voltage is maximum. Although the current is maximum, no power is produced at the short-circuit current due to zero voltage. In addition, no power is produced at the open-circuit voltage due to zero current. The MPP is somewhere between these two points. Maximum power is generated at about the “knee” of the curve. This point represents the maximum efficiency of the solar device in converting sunlight into electricity [70]. A typical I-V curve characteristic of a PV system is given in Fig. 23.8.

PV systems exhibit nonlinear I-V characteristics [71]. There are various models available to mathematically model the I-V characteristics of the PV systems. An equivalent circuit expressing the PV model characteristics is shown in Fig. 23.9. This model is known as single-diode model and is one of the most common equivalent circuits representing PV system behaviors.

In this model, open-circuit voltage and short-circuit current are the key parameters. Illumination or solar radiation affects the short-circuit current, while the open-circuit voltage is affected by the material and temperature. In this model, ISC is the short-circuit current, Is is the diode reverse saturation current, m is the diode ideality factor (generally various between 1 and 5), and VT is the temperature voltage expressed as ![]() , which is 25.7 mV at 25°C. The equations defining this model are
, which is 25.7 mV at 25°C. The equations defining this model are

and

The I-V characteristic of the solar cell can be alternatively defined by [72]

where V is the PV output voltage (V), I is the PV output current (A), Iph is the photocurrent (A), ID is the diode current (A), I0 is the saturation current (A), A is the ideality factor, q is the electronic charge (C), kb is Boltzmann's constant (![]() ), T is the junction temperature (K), Rs is the series resistance (Ω), and Rsh is the shunt resistance (Ω).
), T is the junction temperature (K), Rs is the series resistance (Ω), and Rsh is the shunt resistance (Ω).
23.3.3.6 Sun Tracking Systems
Incident solar radiation is the most important parameter for the power generated by solar energy systems. Sun changes its position during the day from morning to night. Moreover, the sun orbit differs from one season to another. By properly following the sun, through utilizing sun-tracking systems, the incident solar irradiance can be effectively increased [73]. A sun tracker is an electromechanical component used for orienting a solar PV panel, concentrating solar reflector, or lens toward the sun. Solar panels require a high degree of accuracy to ensure that the concentrated sunlight is directed precisely to the PV device. Solar tracking systems can substantially improve the amount of power produced by a system by enhancing morning and afternoon performance. For instance, the orientation of PV panels can increase the solar-electric energy conversion efficiency between 20% and 50% [74–78]. A fixed system oriented to a fixed sun-facing direction will have a relatively low annual production because they do not move to track the sun, which yields significant increase of incident irradiation. An efficient sun-tracking system should be capable of movement from north to south and from east to west as shown in Fig. 23.10.

23.3.3.7 Maximum Power Point Tracking (MPPT) Techniques
The conditions of radiation and temperature affect the current-voltage (I-V) characteristics of solar cells. The voltage and current should be controlled to track the maximum power of the PV systems in order to operate the PV systems at the point of (Vmax and ![]() . Maximum power point tracking (MPPT) techniques are used to extract maximum available power from the solar cells by controlling the voltage and current. Systems composed of various PV modules located at different positions should have individual power conditioning systems to ensure the MPPT for each module [79]. In this section, most common and applicable MPPT techniques are described.
. Maximum power point tracking (MPPT) techniques are used to extract maximum available power from the solar cells by controlling the voltage and current. Systems composed of various PV modules located at different positions should have individual power conditioning systems to ensure the MPPT for each module [79]. In this section, most common and applicable MPPT techniques are described.
Incremental conductance (INC) based maximum power point tracking (MPPT) technique
The incremental conductance technique is the most commonly used MPPT for PV systems [72,80–82]. The technique is based on the fact that the sum of the instantaneous conductance I/V and the incremental conductance ΔI/ΔV is zero at the MPP, negative on the right side of the MPP, and positive on the left side of the MPP.
If the change of current and change of voltage is zero at the same time, no increment or decrement is required for the reference current. If there is no change for the current, while the voltage change is positive, reference current should be increased. Similarly, if there is no change for the current while the voltage change is negative, reference current should be decreased. Contrarily, the change of the current might not be zero. If the current change is not zero, while ![]() , the PV is operating at MPP. If the current change is not zero and
, the PV is operating at MPP. If the current change is not zero and ![]() , then
, then ![]() . If
. If ![]() and
and ![]() , the reference current should be decreased. However, if
, the reference current should be decreased. However, if ![]() and
and ![]() , the reference current should be increased in order to track the MPP.
, the reference current should be increased in order to track the MPP.
Practically, due to the noise and errors, satisfying the condition of ![]() may be very difficult [83]. Therefore, this condition can be satisfied with good approximation by
may be very difficult [83]. Therefore, this condition can be satisfied with good approximation by
where ɛ is a positive small value. Based on this algorithm, either the operating point is located in BC interval, or it is oscillating among the AB and CD intervals as shown in Fig. 23.11.

Selecting the step size (![]() , shown in Fig. 23.11, is a trade-off of accurate steady tracking and dynamic response. If larger step sizes are used for quicker dynamic responses, the tracking accuracy decreases, and the tracking point oscillates around the MPP. On the other hand, when small step sizes are selected, the tracking accuracy will increase. In the meantime, the time duration required to reach the MPP will increase [84].
, shown in Fig. 23.11, is a trade-off of accurate steady tracking and dynamic response. If larger step sizes are used for quicker dynamic responses, the tracking accuracy decreases, and the tracking point oscillates around the MPP. On the other hand, when small step sizes are selected, the tracking accuracy will increase. In the meantime, the time duration required to reach the MPP will increase [84].
The normalized IV, PV (power-voltage), and absolute derivative of PV characteristics of a PV array are shown in Fig. 23.12.
 characteristics of a PV array.
From these characteristics, it is seen that the ![]() decreases as the MPP is approached and it gets greater when the operating point gets away from the MPP. This relation can be given by
decreases as the MPP is approached and it gets greater when the operating point gets away from the MPP. This relation can be given by

In order to obtain the operating MPP, dP/dV should be calculated. The dP/dV can be obtained by only measuring the incremental and instantaneous conductances of the PV array, that is, ΔI/ΔV and I/V [80].

Other maximum power point tracking techniques
In the perturb-and-observe technique, the current drawn from the PV array is perturbed in a given direction, and if the power drawn from the PV array increases, the operating point gets closer to the MPP, and thus, the operating current should be further perturbed in the same direction [85]. If the current is perturbed and this results in a decrease in the power drawn from the PV array, this means that the point of operation is moving away from the MPP, and therefore, the perturbation of the operating current should be reversed.
The P-V and I-V characteristics of a roof-mounted PV array are monotonously increasing or decreasing under stable insulation conditions. The I-V characteristic is a function of voltage, insulation level, and temperature. From these characteristics, MPPT controllers can be developed based on the linearized I-V characteristics [86–88].
Fractional open-circuit voltage-based method [89–96], fractional short-circuit-based method [96,97], fuzzy-logic-controller-based method [88,98–106], neural-network-based method [107–112], ripple-correlation-based method [113], current-sweep-based method [114], and dc-link capacitor droop-control-based method [115,116] are the other applicable methods for MPP tracking.
23.3.3.8 Power Electronic Interfaces for PV Systems
Power electronic interfaces are used either to convert the dc energy to ac energy to supply ac loads or connection to the grid or to control the terminal conditions of the PV module to track the MPP for maximizing the extracted energy. They also provide wide operating range, capability of operation over different daily and seasonal conditions, and reaching the highest possible efficiency [117]. There are various ways to categorize power electronic interfaces for solar systems. In this book, power electronic interfaces are categorized as power electronic interfaces for grid-connected PV systems and stand-alone PV systems.
Power electronic interfaces for grid connected PV systems
The power electronic interfaces for grid-connected PV systems can be classified into two main criteria: classification based on inverter utilization and classification based on converter stage and module configurations.
Topologies based on inverter utilization
The centralized inverter system is illustrated in Fig. 23.13.

In this topology, PV modules are connected in series and parallel to achieve the required current and voltage levels. Only one inverter is used in this topology at the common dc bus. In this topology, the inverter's power losses are higher than string inverter or multi-inverter topologies due to the mismatch between the modules and necessity of string diodes that are connected in series. In this topology, voltage boost may not be required since the voltage of series-connected string voltages is high enough [118].
In string inverter topology, the single string of modules is connected to the separate inverters for each string [119]. In this topology, voltage boosting may not be required if enough number of components are connected in series in each string.
In the multistring inverter topology, several strings are interfaced with their own integrated dc/dc converter to a common dc/ac inverter [120,121] as shown in Fig. 23.14.
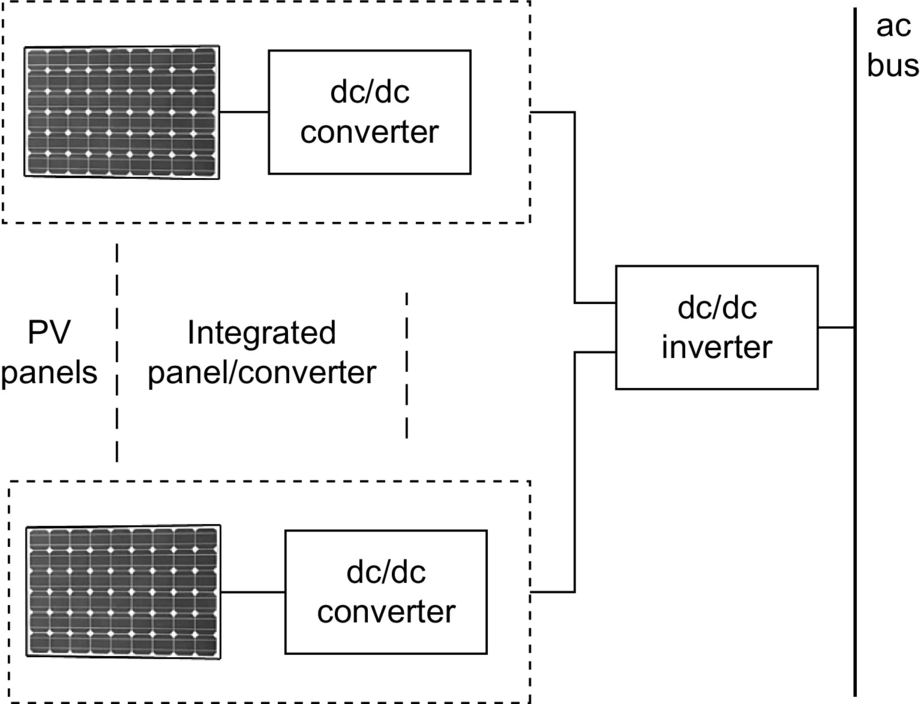
Therefore, this is a flexible design with high efficiency. In this topology, each PV module has its integrated power electronic interface with utility. The power loss of the system is relatively lower due to the reduced mismatch among the modules, but the constant losses in the inverter may be the same as for the string inverter. In addition, this configuration supports optimal operation of each module, which leads to an overall optimal performance [118]. This is due to the fact that each PV panel has its individual dc/dc converter and maximum power levels can be achieved separately for each panel.
Topologies based on module and stage configurations
The power electronic conditioning circuits for solar energy systems can be transformerless, or they can utilize high-frequency transformers embedded in a dc/dc converter, which avoids bulky low-frequency transformers. The number of stages in the presented topologies refers to the number of cascaded converters/inverters in the system.
Isolated dc/dc converters consist of a transformer between the dc/ac and ac/dc conversion stages [122]. This transformer provides isolation between the PV source and load. A typical topology is depicted in Fig. 23.15.

In the topology shown in Fig. 23.15, the outputs of the PV panel and dc/dc converter are dc voltages. The two-stage dc/dc converter consists of a dc/ac inverter, a high-frequency transformer, and a rectifier. In this topology, a capacitor can be used between the bottom leg of the high-frequency inverter and the transformer, forming an LC resonant circuit with the equivalent inductance of the transformer. This resonance circuit reduces the switching losses of the inverter. Alternatively, only two switches are enough if a push-pull converter is used; however, this topology requires a middle terminal outputted transformer [118].
The topologies shown in Fig. 23.16A and B are two-stage single-module topologies, in which a dc/dc converter is connected to a dc/ac converter for grid connection. The dc/dc converter deals with the MPP tracking, and the dc/ac inverter is employed to convert the dc output to ac voltage for grid connection. These are nonisolated converters since they are transformerless.

Instead of using a full-bridge inverter for the dc/ac conversion stage, a half-bridge inverter can also be used. In this way, number of switching elements can be reduced, and the controller can be simplified; however, for the dc bus, two-series-connected capacitor is required to obtain the midpoint. This midpoint of two-series-connected capacitors will be used as the negative terminal of the ac network of the half-bridge configuration.
The single-stage inverter for multiple modules is depicted in Fig. 23.17, which is the simplest grid-connection topology [123]. The inverter is a standard voltage-source PWM inverter, connected to the utility through an LCL filter. The input voltage, generated by the PV modules, should be higher than the peak voltage of the utility. The efficiency is about 97%. On the other hand, all the modules are connected to the same MPPT device. This may cause severe power losses during partial shadowing. In addition, a large capacitor is required for power decoupling between PV modules and utility [124].

A topology for multimodule multistring interfaces is shown in Fig. 23.18 [121,125]. The inverter in Fig. 23.18 consists of up to three boost converters, one for each PV string, and a common half-bridge PWM inverter. The circuit can also be constructed with an isolated current- or voltage-fed push-pull or full-bridge converter [126] and a full-bridge inverter toward the utility. The voltage across each string can be controlled individually [121,126].

As an alternative to the topology shown in Fig. 23.18, other types of dc/dc converter can be employed to the first stage, such as isolated dc/dc converters.
Power electronic interfaces for stand-alone PV systems
The stand-alone PV systems are composed of a storage device and its controller for sustainable satisfaction of the load power demands [127]. The storage device with the controller should provide the power difference when the available power from the PV panel is smaller than the required power at the load bus [128]. When the available power from the PV panel is more than the required power, the PV panel should supply the load power, and the excess power should be used to charge the storage device. A simple PV panel/battery connection topology is shown in Fig. 23.19.

In this simple topology, the dc/dc converter between the battery and the PV panel is used to capture all the available power from the PV panel. In this system, battery pack acts as an energy buffer, charged from the PV panel and discharged through the dc/ac inverter to the load side. The charging controller determines the charging current of the battery, depending on the MPP of the PV panels at a certain time. When there is no solar insulation available, the dc/dc converter disables, and the stored energy within the battery supplies the load demands. The battery size should be selected so that it can supply all the power demands during a possible no-insulation period. In addition, it could be fully charged during the insulated periods to store the energy for future use. Since the combined model produces ac electric energy, it should be converted to ac electric energy for domestic electric loads. The combined system requires a dc/ac inverter, which is also used to match the different dynamics of the combined energy system and various loads. The proper response of the PV/battery system to the overall load dynamics can be achieved by generating appropriate switching signals to the inverter while modulating for both active and reactive powers. The load bus voltage can be controlled by the modulation index control of the inverter; while the load control can be achieved by the phase angle control of the inverter.
23.3.4 Wind Turbines and Wind Energy Conversion Systems
Wind turbines are devices that are capable of capturing the kinetic energy of winds. This kinetic energy is converted to mechanical energy to rotate the turbine that is coupled to an electric generator. In this way, kinetic energy of the wind can be converted into a usable form of energy, that is, electric energy. Wind turbines can be installed stand-alone to power remote or isolated locations, or they can be grid-connected, to supply power to the utility grid. Wind power is renewable, widely distributed, plentiful, and it is a clean way of energy conversion. Additionally, it contributes in reducing the greenhouse gas emissions since it can be used as an alternative to fossil-fuel-based power generation [129]. Although wind energy has a great potential to significantly contribute the world's power generation, only 1% of worldwide power requirement is supplied by wind turbines [130].
Several key parameters such as air density, area of the blades, wind speed, and rotor area need to be considered in order to efficiently capture wind energy. Wind force is converted into a torque that rotates the blades of wind turbine. The wind force is stronger in higher air densities. In other words, kinetic energy of the wind depends on air density, and heavier winds carry more kinetic energy. At normal atmospheric pressure and at 15°C, the weight of the air is 1.225 kg/m3, but if the humidity increases, the density decreases slightly. The other fact that determines the air density is whether the air is warm or cold. Warmer winds are less dense than cold ones, so at high altitudes, the air is less dense [131]. Besides the area of the blades (air swept area), the diameter of the blade plays important role in captured wind energy. Under the same conditions, more wind can be captured with longer blades and bigger rotor area of wind turbine [130,131]. The other parameter is the wind speed. It is expected that wind kinetic energy arises as wind speed increases [131].
Kinetic energy of the wind can be expressed as
where Ek represents kinetic energy of the wind, m stands for the mass of the wind, v is wind speed, ρ is air density, A is rotor area, R is blade length, and d stands for thickness of the “air disc” shown in Fig. 23.20.

Hence, the overall wind power (![]() is [131]
is [131]

From (23.10), it can be seen that the power content of the wind varies with the cube (the third power) of the average wind speed as shown in Fig. 23.21.

23.3.4.1 Wind Turbine Power
Betz's law
The theoretical maximum power that can be extracted from the wind is demonstrated by Betz's law [132,133]. The wind turbines extract the kinetic energy of the wind. Higher wind speed results in higher extracted energy. It should be noted that the wind speed after turbine (after passes through turbine) is much lower than before it comes to the turbine (before energy is extracted) since the wind loses its speed by transferring its kinetic energy to wind turbine. That means wind speed before wind approaches (in front of) the turbine and its speed after (behind) turbine are different. Fig. 23.22 shows both speeds. The wind after the turbine has less amount of energy due to decreased speed of wind.

The decreased wind speed, after turbine, provides information on the amount of possible extracted energy from the wind. The extracted power from the wind can be calculated using (23.7)

where Pextracted shows maximum extracted power from the wind, va and vb are wind speeds after and before passing through the turbine, ρ is the air density, and R demonstrates the radius of the blades.
The relation of total amount of power Ptotal to the extracted power Pextracted can be calculated as

For the maximum power extraction, the ratio of the wind speed after and before the turbine can be calculated using ![]() .
.
Solving (23.12) for va/vb yields

As a result, (23.12) reaches its maximum value for ![]() .
.

Eq. (23.14) shows that the maximum extracted power from the wind is 59.3% of the total available power. In other words, it is not possible to extract all 100% of wind energy since the wind speed after turbine cannot be 0.
Betz's law indicates that the maximum theoretical extracted wind power is 59%. However, in practice, the real efficiency of wind turbine is slightly different.
23.3.4.2 Different Electrical Machines in Wind Turbines
There are many types of electric machines that are used in wind turbines. There is no clear criterion for choosing a particular machine to work as a wind generator. Based on the installed power, site of turbine, load type, and simplicity of control, the wind generator can be chosen. Squirrel-cage induction or brushless DC (BLDC) generators are usually used for small wind turbines in household applications. Doubly fed induction generators are usually used for megawatt size turbines. Synchronous machines and permanent-magnet synchronous machines (PMSM) can also be used for wind-turbine applications.
Brushless DC (BLDC) machines
Brushless DC machines (BLDC) are very popular in many applications due to the recent advances in their development. In addition, the development of fast semiconductor switches, cost-effective DSP processors, and other microcontrollers have influenced the development of the motor/generator drives. Brushless DC machines (BLDC) are widely used because of their simple control, efficiency, compactness, lightweight, ease of cooling, less noise, and low maintenance [134,135]. Usually, BLDC machines are used in small wind turbines (up to 15 kW).
The simplified equivalent circuit of the BLDC generator connected to a diode rectifier is shown in Fig. 23.23. This is the simplest way of using BLDC machine for wind applications, because there is no switch to control the phase current. The full bridge rectifies the induced voltages of variable frequency (because of variable wind speeds). Basically, the waveform of the induced electromotive force (EMF) is converted to dc voltage regardless of the input waveform. Usually, these types of wind turbines are connected to batteries; therefore, rectified electric power is used to charge the battery.

Three-phase active synchronous rectifiers can be used with BLDC generators. In this case, the controlled rectifier is used for BLDC phase current control. Usually, hysteresis regulators are used to control current. In synchronous rectifiers, active switching devices such as IGBTs or MOSFETs are used. By employing a PWM control strategy for the synchronous rectifier, MPP tracking of the wind turbine can be achieved. An inverter can be placed at the dc bus for grid interconnection or powering the ac loads.
Permanent magnet synchronous machines
For both fixed and variable speed applications, permanent-magnet (PM) synchronous machines can be used. The permanent-magnet synchronous generator (PMSG) is very efficient and suitable for wind-turbine applications. PM synchronous generators allow direct-drive energy conversion for wind applications. Direct-drive energy conversion helps eliminating the gearbox between the turbine and generator; thus, these systems are less expensive, and less maintenance is required [136,137]. However, lower speed determined by the turbine shaft is the operating speed for the generator.
A wind power system where a PM synchronous generator is connected to a full-bridge rectifier followed by a boost converter is shown in Fig. 23.24. In this case, the boost converter controls the electromagnetic torque. The supply side converter regulates the dc-link voltage and controls the input power factor. One drawback of this configuration is the use of diode rectifier that increases the current amplitude and losses. The grid-side converter can be used to control active and reactive power being supplied to the grid. Automatic voltage regulator (AVR) obtains the information of speed of turbine, dc-link voltage, current, and grid-side voltage and current. It calculates PWM pattern (control scheme) for converter. This configuration has been considered for small size (less than 50 kW) wind power systems (WPS) [138].

Instead of using a diode rectifier cascaded by a dc/dc converter, both rectifier and inverter can be controllable. A PMSG where the PWM rectifier is placed between the generator and the dc link, and PWM inverter is connected to the utility is shown in Fig. 23.25. In this case, the back-to-back converter can be used as the interface between the grid and the stator windings of the PMSG [139]. The turbine can be operated at its maximum efficiency, and the variable speed operation of PMSG can be controlled by using a power converter that is utilized to regulate the maximum power flow. The stator terminal voltage can be controlled in several ways [140]. In this system, utilizing the field orientation control (FOC) allows the generator to operate near its optimal working point in order to minimize the losses in the generator and power electronic circuit. However, the performance depends on the knowledge of the generator parameter that varies with temperature and frequency. The main drawbacks are the cost of PMs that increases the price of the machine and demagnetization of the PMs. In addition, it is not possible to control the power factor of the machine [134].

Squirrel cage induction machines
The three-phase induction machines are commonly used in industrial motor applications. However, they can also be effectively used as generators in electric power systems. The main issue with induction machines as electric power generators is the need for an external reactive power source that will excite the induction machine, which is certainly not required for synchronous machines in similar applications. If induction machine is connected to the grid, the required reactive power can be provided by the power system. Induction machine may be used in cogeneration with other synchronous generators, or the excitation might be supplied from capacitor banks (only for stand-alone self-excited generator application) [141–146]. The reactive power required for excitation can be supplied using static VAr compensators [147,148] or static compensators (STATCOMs) [149].
Due to its low cost, brushless rotor construction does not need a separate source for excitation. No maintenance and self-protection against severe over loads, short circuits, and self-excited induction generators are used in wind-turbine applications [142–146]. The only drawback of these types of generators can be their inherent generated voltage and frequency regulation under varied loads [150].
Common structure of a squirrel-cage induction generator with back-to-back converters is shown in Fig. 23.26. In this structure, stator winding is connected to utility through a four-quadrant power converter. Two PWM VSI are connected back-to-back through a dc link. The stator-side converter regulates the electromagnetic torque and supplies reactive power, while the grid-side converter controls the real and reactive power delivered from the system to the utility and regulates the dc link. This topology has several practical advantages, and one of them is the possibility of fast transient response for speed variations. In addition, the inverter can operate as a VAR/harmonic compensator [151].

On the other hand, the main drawback is the complex control system. Usually, FOC is used to control this topology, where its performance relies on the generator parameters, which vary with temperature and frequency. Hence, in order to supply the magnetizing power requirements, that is, to magnetize the machine, the stator-side converter must be oversized 30%–50% with respect to rated power.
Doubly fed induction generator (DFIG)
Fig. 23.27 presents a topology consisting of a doubly fed induction generator (DFIG) with ac/dc and dc/ac converters, that is, a four-quadrant ac/ac converter using IGBTs connected to the rotor windings. In the DFIG topology, the induction generator is not a squirrel-cage machine, and the rotor windings are not short-circuited. Instead, they are used as the secondary terminals of the generator that provides the capability of controlling the machine power, torque, speed, and reactive power. To control the active and reactive power flow of the DFIG topology, rotor- and grid-side converters should be controlled separately [152–155].

Wounded rotor induction machines can be supplied from both rotor and stator sides. The speed and the torque of the wounded rotor induction machine can be controlled by regulating voltages from both rotor and stator sides of machine. The DFIG can be considered as a synchronous/asynchronous hybrid machine. In the DFIG, similar to the synchronous generator, the real power depends on the rotor voltage magnitude and angle. In addition, the induction machine slip is also a function of the real power [156]. DFIG topology offers several advantages in comparison with systems using direct-in-line converters [157,158]. These benefits are the following:
• The main power is transferred through the stator windings of the generator that is directly connected to the grid. Around 65%–75% of the total power is transmitted through stator windings. The remaining power is transmitted using the rotor windings, that is, through the converters, which is about 25% of the total power. Since the inverter rating is 25% of total system power, the inverter cost and size can considerably be reduced.
• While the generator losses are the same in both topologies (direct-in-line and DFIG), the inverter losses can be reduced from around 3% to 0.75%, because the inverter is supposed to only transfer 25% of the total power. Therefore, approximately 2%–3% efficiency improvement can be obtained.
• DFIG topology offers a decoupled control of generator active and reactive powers [159,160].
• Cost and size of the inverter and EMI filters can be reduced since the inverter size is reduced. In addition, the inverter harmonics are lowered because the inverter is not connected to the main stator windings.
In the rotor circuit, two voltage-fed PWM converters are connected back to back, while the stator windings are directly connected to the ac grid side as shown in Fig. 23.27. The direction and magnitude of power between the rotor windings and stator windings can be controlled by adjusting the switching of the PWM signals of the inverters [161–163]. This is very similar to connecting a controllable voltage source to the rotor circuit [164]. This can also be considered as a conventional induction generator without a zero rotor voltage.
To take the benefits of variable speed operation, the optimum operating point of the torque-speed curve should be tracked precisely [165]. By controlling the torque of the machine, speed can be adjusted. Thus, using the instantaneous rotor speed value and by controlling the rotor current iry in stator-flux-oriented reference frame, the desired active power can be obtained. Operation at the desired active power results in the desired speed and torque [153]. On the other hand, the grid-side converter is controlled to keep the fixed dc-link voltage independent of the direction of rotor power flow. By using supply voltage vector-oriented control, the decoupled control of active and reactive power flow between rotor and grid can be obtained.
Using doubly fed induction generator, the oversizing problem can be solved. Still, speed range of turbine is wide enough; thus, a power converter, which is rated for much lower powers, can be placed in rotor side only, and stator is connected to grid directly. Since power flowing through rotor is usually around 25%–30% of power going through stator, the power electronic interface is designed for only 25%–30% of total power. This is the most important advantage of DFIG.
Synchronous generators
Synchronous generators are commonly used for variable speed wind-turbine applications, due to their low rotational synchronous speeds that produce the voltage at grid frequency. Synchronous generators can be an appropriate selection for variable speed operation of wind turbines [166,167]. They do not need a pitch control mechanism. The pitch control mechanism increases the cost of the turbine and causes stress on turbine and generator [168]. Synchronous generators in variable speed operation will generate variable voltage and variable frequency power. Using an AVR for the excitation of the field voltage, the output voltage of the synchronous generator can be controlled. However, induction generators require controlled capacitors for voltage control. In addition, their operating speed should be over synchronous speed in order to operate in generating mode [169].
Multipole synchronous generators can be used more efficiently since the gear can be eliminated, and direct drive of the turbine and generator can be achieved [170,171]. However, synchronous generators without multipoles require gearboxes in order to produce the required frequency for grid connection. On the other hand, a dc voltage source or an ac/dc converter is required for synchronous generators in wind applications in order to produce the required excitation voltage for the field windings. The synchronous generator connection with wind turbine is shown in Fig. 23.28.

23.3.4.3 Energy Storage Applications for Wind Turbines
The batteries and other dc energy storage devices can be connected to the dc links of any topologies. The main purpose of batteries is to assist the generator to meet the load demand. When the load current is smaller than generator current, the extra current is used to charge the battery energy storage. On the other hand, when the load current is larger than generator current, the current is supplied from the battery to the load. With this strategy, the voltage and frequency of the generator can be controlled for various load conditions. Energy storage decreases system inertia, improves the behavior of the system in the case of disturbances, compensates transients, and therefore improves the efficiency [172]. However, it brings an initial cost to the system and requires periodical maintenance depending on the storage devices. Therefore, the voltage and frequency control can be modified by using batteries as the controllable load of the VSI as presented in Fig. 23.29. In this way, the load can be regulated by controlling the power flow to the batteries. A bidirectional inverter/converter can be used for power flow from/to the batteries. As another alternative, the battery voltage can be converted to ac voltage with another individual inverter to provide power to AC loads. Although an induction generator is shown in Fig. 23.29, these energy storage systems are applicable to any other topologies.

Storage systems can be connected in various forms to the wind-turbine systems [173–177]. Generally, a bidirectional dc/dc converter is required for the integration of the storage system to the doubly fed induction generator system [178]. In this topology, one of the converters regulates the storage power, whereas the other is responsible for dc bus voltage control. The bidirectional energy storage topology for DFIGs in wind applications is shown in Fig. 23.30.

23.3.5 Ocean Energy Harvesting
23.3.5.1 Ocean Wave Energy
Ocean waves are a plentiful, clean, and renewable source of energy. The total power of waves breaking around the world's coastlines is estimated at 2–3 million megawatts. The west coasts of the United States and Europe and the coasts of Japan and New Zealand are good sites for harnessing wave energy [179]. Wave energy conversion is one of the feasible future energy technologies; however, it is not mature enough. Therefore, the construction cost of wave power plants is considerably high. These energy systems are not developed and maturated commercially due to the problems of dealing with sea conditions, complexity, and difficulty of interconnection and transmission of electricity.
A wave power absorber, a turbine, a generator, and the power electronic interfaces are the main components of a typical ocean wave energy harvesting technique. The kinetic energy of the ocean waves are captured by absorbers. Either the absorbed kinetic energy of the waves is conveyed to turbines or the absorber directly drives the generator. The shaft of the electric generator is driven by the turbine. Turbines are generally used within the systems including rotational generators. Linear motion generators are used in systems without turbines, which can be direct driven by the power absorber or movement of the device. Due to the varying amplitude and period of the ocean waves, both linear and rotational generators generate variable frequency—variable amplitude ac voltage. This ac voltage can be rectified to dc voltage to take the benefit of dc energy transmission through the salty ocean water. dc transmission in salty water does not require an additional cable for the negative polarity. Thus, it will be more cost-effective than transmitting the power in ac form, which requires three-phase cables. Transmission cable length varies depending on the location of the application, which is either nearshore or offshore. However, the main idea and the principles are the same for both types of applications. After the dc power is transmitted from ocean to the land, a dc/dc converter or a tap-changing transformer can be used for voltage regulation. Depending on the utilized voltage regulation system, a dc/ac inverter is used before or after the voltage regulator. The voltage synchronization is provided by the inverter, and the output terminals of the inverter can be connected to the grid.
In Fig. 23.31, a system level diagram of the ocean wave energy harvesting technology is shown. At an in-water substation, wave energy conversion devices (including the absorber, turbine, and generator) are interconnected. The substation consists of the connection equipments and controllers for individual devices. The outputs of the generators are connected to a common dc bus using dc/ac converters for transforming power before transmission to the shore. A transmission line connects the cluster to shore. An onshore inverter converts the dc voltage to a 50 or 60 Hz ac voltage for grid connection. An optional shore transformer with tap changer or a dc/dc converter compensates the voltage variations. A group of absorber, turbine, and generators could be used in a farm structure; thus, the captured energy can be increased.
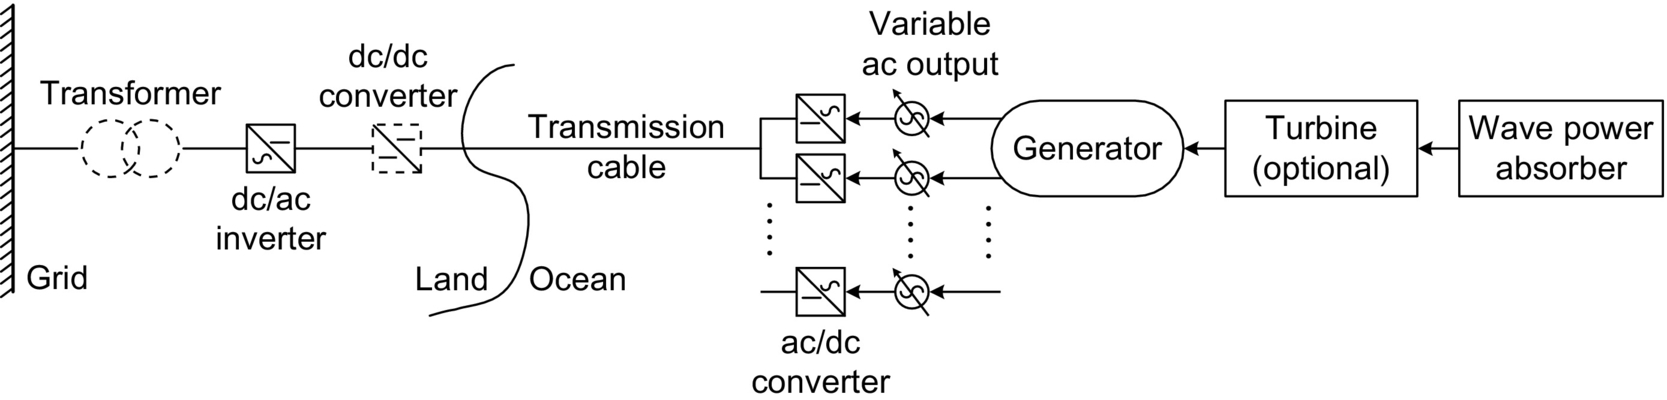
Alternatively, the land converters might be moved offshore to come up with space limitations that may occur in land stations. This brings some complexity to the system and may require more maintenance, which is harder to deal, in comparison with landside converters. Moreover, the transformer can be installed offshore. This would increase the power transmission capability, since the higher voltage transmission will result in less transmission losses. However, in this case, the advantage of dc transmission will not exist. As a different option, boost dc/dc converters can be used after the ac/dc converter of the generator. This allows a high-voltage dc transmission link. In this case, both transmission losses will be kept at minimum, and only single-line dc transmission through the ocean water will be required.
Energy of ocean waves
The total potential and kinetic energy of an ocean wave can be expressed as
where g is the acceleration of gravity (9.8 m/s2), ρ is the density of water (1000 kg/m3), and A is the wave amplitude (m).
The power of a wave in a period is equal to the energy E multiplied by the speed of wave propagation, vg, for deep water
where T is the wave period (seconds) and L is the wave length (m) [180].
The dispersion relationship describes the connection between the wave period T and the wave length L as

If (23.18) is substituted in (23.17), the power or energy flux of an ocean wave can be calculated as

Instead of using the wave amplitude, wave power can also be rewritten as a function of wave height, H [m]. Considering that the wave amplitude is the half of the wave height, the wave power becomes

Ocean wave energy harvesting technologies
In general, ocean wave energy harvesting technologies can be classified into two types with respect to their distance from the shore: offshore ocean wave energy harvesting technologies and onshore ocean wave energy harvesting technologies. These are discussed in details in following subsections.
Off-shore ocean wave energy harvesting technologies
Offshore applications are located away from the shore, and they generally use a floating body as wave power absorber and another body that is fixed to the ocean bottom. Generally, linear generators with buoys are used in offshore applications. Linear generators are directly driven by the movement of a floating body on the ocean. Salter cam and buoys with air-driven turbines are the only applications involving rotational generators in offshore applications.
23.3.5.1.2.1.1 Air-Driven Turbines based Off-Shore Technologies
In air-driven turbine systems for offshore applications, the primary conversion is from wave to the pressurized air. Secondary conversion stage is the conversion to mechanical energy by rotating shaft of the turbine. The last stage is converting mechanical rotation into electric power by electric generators.
The operating principle of an offshore application that consists of a floating buoy with an air chamber and an air-driven generator is shown in Fig. 23.32. In this system, the water level inside channel of the buoy increases when the waves hit the body. This increase in water level applies a pressure to the air in the air chamber. When the air is pressurized, it applies a force to the ventilator turbine and rotates it. This turbine drives the electric generator, and electricity is generated at the output terminals of this generator. When the waves are pulled back to the ocean, the air in the air chamber is also pulled back since the water level in the buoy channel decreases. Due to the syringe effect, this time, turbine shaft rotates in the contrary direction but produces electricity. There should be very good mechanical insulation through the air chamber and the ventilating generator to achieve higher efficiencies. However, this brings design complexity and additional cost to the system.

In another method, water level increases, and air is taken out from the upper outlets while spinning the turbines as shown in Fig. 23.33A. Contrarily, when the waves are pulled back to the sea, water level decreases. This results in sucking the air back from the upper inlets while spinning the turbines, as shown in Fig. 23.33B.

23.3.5.1.2.1.2 Direct-drive permanent-magnet linear generator-based buoy applications
The height differences of the wave top and bottom levels yield an up and down motion for the piston that is the transaxle of the linear generator. When the wave is floating on the ocean surface, the buoy follows the motion of the wave. Buoy can move vertically on a pillar, which is connected to a hull. On the surface of the hull, PMs are mounted, while outside of the hull contains the coil windings. The pillar and stator are connected together on a concentrate foundation standing on the seabed of the ocean. The hull and mounted magnets, called rotor or piston, are the moving parts of the generator. Since the motion is linear, this generator is called a linear generator.
In Fig. 23.34, the linear generator in the floating buoy and fixed pillar are shown.

When the wave rises, the buoy will drive the generator piston through a stiff rope. When the wave subsides, the generator will be driven by the spring that stores the mechanical energy in the first case. Thus, electric generation is provided during both up and down motion. Due to the existence of variable frequency in the current and voltage from the stator, an ac/dc rectifier followed by a dc/ac converter is required to make the grid connection possible. Instead of placing moving parts to the ocean bottom, the PMs and the stator windings can be placed at the sea level [182]. Fig. 23.35 shows the x-y plane of the cross-sectional view of one pole of the longitudinal flux surface mounted linear PM generator.

23.3.5.1.2.1.3 Salter Cam Method
Salter cam method implementation is shown in Fig. 23.36. Salter cam rolls around a fixed inner cylinder by activation of an incoming wave. Through the differential rotation between the cylinder and the cam, power can be captured. The motion of the cam is converted from wave to a hydraulic fluid. Then, hydraulic motor is used to convert the pressurized hydraulic fluid to rotational mechanical energy. Finally, rotational mechanical energy is converted to electricity by utilizing electric generators. Flywheels or pressurized liquids can be used as an intermediate step in order to reduce the intermittencies of the wave power.

Near-shore ocean wave energy harvesting technologies
Nearshore topologies are applied within the surfing zone of the ocean or right on the shore. Nearshore applications have some advantages and disadvantages in comparison with the offshore applications.
23.3.5.1.2.2.1 Channel/reservoir/turbine based near-shore wave energy harvesting method
Wave currents can be tapered into a narrow channel to increase their power and size in order to harness the wave energy. As shown in Fig. 23.37, waves can be channeled into a catch basin and used directly to rotate the turbines. Since this method requires building a reservoir to collect the water coming with the waves to drive the turbine, it is more expensive in comparison with the other buoy-shaped offshore applications. However, it requires less maintenance in comparison with the offshore applications, since all components of the wave energy conversion system are located on land. Additionally, since a reservoir collects the ocean water, the intermittencies can be eliminated. This will create a convenient platform for voltage and frequency regulation. Building these types of plants in the locations, where they have regular and sustaining wave regimes, is more advantageous.
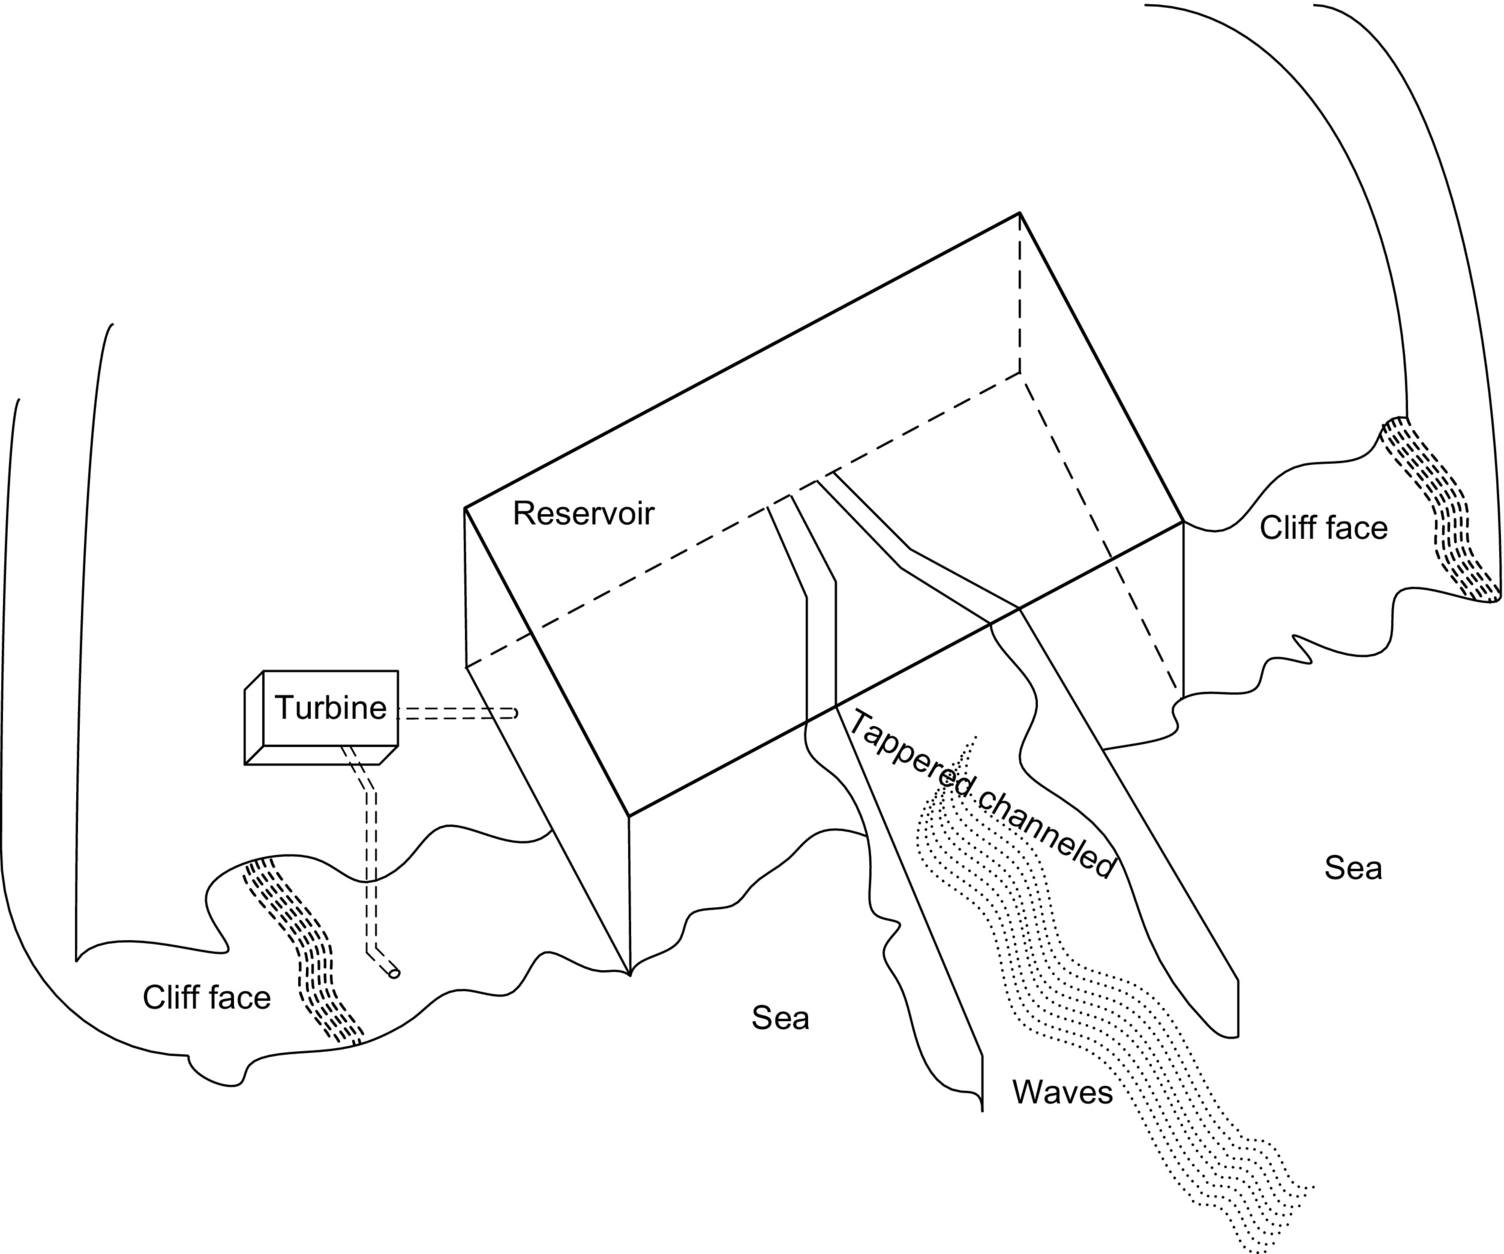
23.3.5.1.2.2.2 Air-driven turbines based near-shore wave energy harvesting method
Using oscillating water columns (OWC) that generates electricity from the wave-driven rise and fall of water in a cylindrical shaft or pipe is another way to harness the wave energy. The air is driven into and out of the top of the shaft due to the rising and falling water, powering an air-driven turbine that is shown in Fig. 23.38.
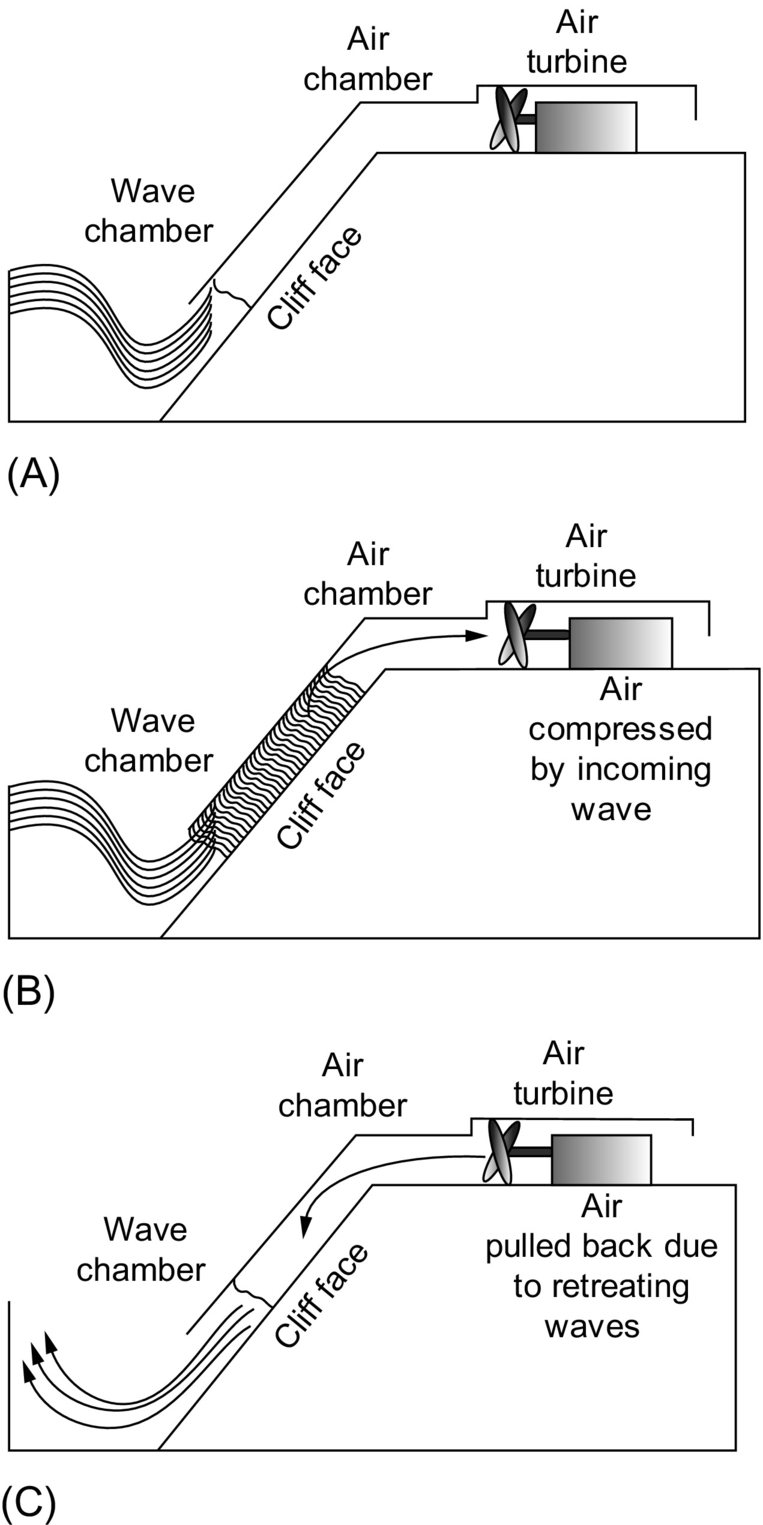
The general structure of the nearshore air-driven turbine is shown in Fig. 23.38A. Waves push the air through the ventilator that drives the electric machine as shown in Fig. 23.38B. The wave retreats from the wave chamber inside the channel that decreases the pressure as shown in Fig. 23.38C. This method is advantageous because of the capability of using not only the wave power but also the power from the tidal motions. However, mechanical isolation should be provided within the wave and air chambers in order to obtain better efficiencies. This will also bring some more cost and design complexities to the system.
23.3.5.2 Ocean Tidal Energy
The generation of electric power from ocean tides is similar to the traditional hydroelectric generation. A dam, known as a barrage, across an inlet is required for the simplest tidal power plants. In a tidal power plant, usually, a tidal pond created by a dam and a powerhouse, which contains a turbo generator, and a sluice gate to allow the bidirectional tidal flow. During the flood tide, the rising tidal waters fill the tidal basin after opening the gate of the dam. When the dam is filled to capacity, the gates are closed. The tidal basin is released through a turbogenerator after the ocean waters have receded. Power can be generated during ebb tide, flood tide, or both. When the water is pulled back, ebb tide occurs, and when the water level increases near the shore, flood tide happens [183]. Tidal power can be economical at sites where mean tidal range exceeds 16 ft [183,184].
Tidal current is not affected by the climate change, the lack of rain, or a snowmelt. Therefore, tidal energy harvesting is practical since the tidal current is regular and predictable. Moreover, environmental and physical impacts and pollution issues are negligible. Tidal power can additionally be used for water electrolysis for hydrogen production applications and desalination. However, tidal power generation is an immature technology, which needs further investigations and developments.
Tidal turbines can be used for tidal energy harvesting, similar to the wind turbines. Tidal turbines can be located where there is a strong tidal flow. These turbines have to be much stronger than wind turbines since the water is about 800 times as dense as air. They will be heavier and more expensive; however, they will be able to capture more energy at much higher densities [181]. In Fig. 23.39, a typical tidal turbine is shown.

Usually, tidal fences having multiple turbines are mounted in the entrance of channels that are affected by ocean tides. Tidal water is forced to pass through a fence structure, which is called caisson in this fence application. Unlike barrage stations, basins are not required for fence applications, and they can be used in a channel between the mainland and a nearby offshore island or between two islands. Tidal fences can be mounted at the entrance of channels that ocean water gets inside the land via a bay (Fig. 23.40A), or between the main land and an island (Fig. 23.40B), or simply between two islands (as shown in Fig. 23.40C). Since they do not require flooding the basin, tidal fences have much less impact on the environment. In addition, they are significantly cheaper to install; however, the caisson may disrupt the movement of large marine animals and shipping [T4].

23.3.5.3 Power Electronic Interfaces for Ocean Energy Harvesting Applications
Both in ocean wave and ocean tidal energy harvesting applications, the generators may produce alternating currents and voltages that have varying magnitude and frequency. Therefore, output power of the ocean energy converters need further conditioning prior to the grid connection. In addition, the frequency of the output voltage should be regulated to be the same as grid frequency. Output power conditioning, amplitude, phase, and frequency of the conversion system can be regulated by utilizing power electronic converters.
Block diagram of a typical power conditioning system for a grid-connected ocean energy conversion system is shown in Fig. 23.41. Ocean wave or ocean tide potential and kinetic energies rotate the water turbine, or a power absorber directly drives a linear generator with up and down motions. The varying wave and tides result in variable frequency and amplitude of the generator output. The ac power produced by the generator is converted into dc power via three-phase bridge rectifiers followed by a dc/ac inverter. The output of the dc/ac inverter generally contains harmonics, which should be filtered. Finally, output power can be connected to grid and transmitted to consumers after its voltage is increased and isolated by a power transformer.

During the intermittencies, power cannot be generated. Therefore, an energy storage system should be connected to the generator output or output of a conversion stage in the power conditioning system. Stored energy can be supplied to the grid during the intermittency periods. Hence, it is ensured that continual power is supplied to the grid.
23.3.6 Geothermal Energy Systems
Geothermal energy is the thermal energy that is stored in the inner layers of the Earth composed of rocks and fluids. The temperature of the inner layers of the Earth gets hotter as the depth increases. In deeper layers, it is even extremely hotter due to the hot molten rock called magma [185,186].
Geothermal energy can be utilized by several methods. It can be used as direct heat for electric power generation. In the direct heat utilization, applications can be categorized as hydrothermal, agricultural, or industrial [187]. Hydrothermal resources have low to moderate temperatures between 20 and 150°C. These resources can be utilized to provide direct heating for residential, industrial, and commercial sectors [188]. These applications include but are not limited to water and space heating, greenhouse and agricultural heating, cleaning, textile processes, and food dehydration. Agricultural production is one of the utilization methods of direct use of geothermal energy. It is used to warm the greenhouses in order to provide cultivation. Industrial utilization examples can be food and cloth processing, manufacturing paper, pasteurizing milk, drying fish, vegetables and fruits, and even for refrigeration and air conditioning.
Other than the direct use of geothermal energy, it can be used as the heat and steam source for electric power plants. Instead of burning fossil fuels and generating heat for water boiling, geothermal power plants use the readily obtained heat or steam. Natural hot water and/or steam from the inner layers of the Earth are used to drive the turbines and generators to produce electricity. Absolutely, no fuel firing is required for heating or steam generation for geothermal power plants. Therefore, geothermal power plants do not have emissions, and they are environmentally clean. Moreover, since the extracted heat is replaced by the thermal energy of the Earth's inner layers, geothermal energy is sustainable and renewable.
Schematic of a geothermal power plant is presented in Fig. 23.42.
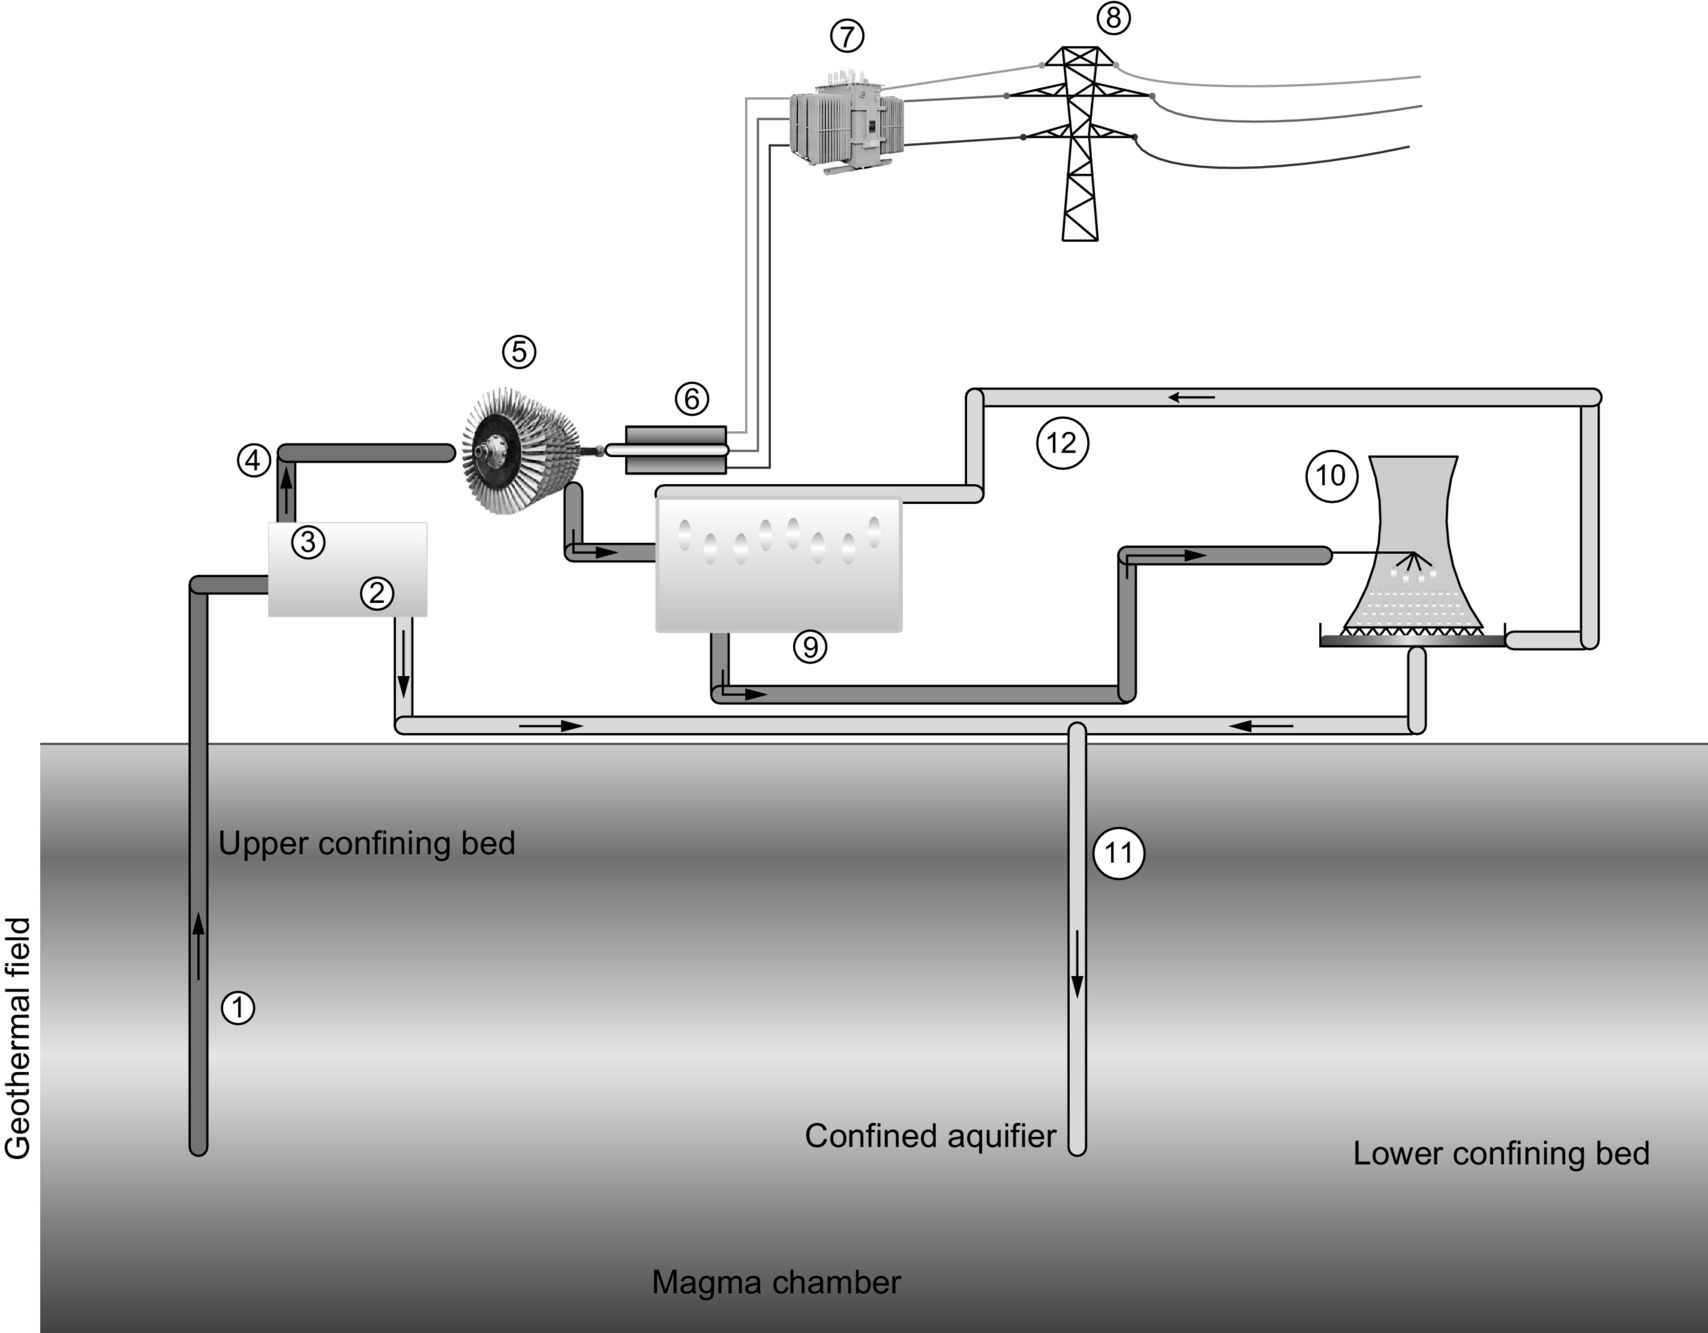
The components of the geothermal power plant are described in Table 23.6.
Table 23.6
Geothermal power plant components
| 1—Production well | 7—Power transformer |
| 2—Water-steam mix | 8—High-voltage transmission lines |
| 3—Separator | 9—Condenser |
| 4—Steam | 10—Cooling tower |
| 5—Steam turbine | 11—Injection well |
| 6—Generator | 12—Water flow cycle |
The operating principle of a geothermal power plant is very similar to that of a coal-fired power plant. However, in geothermal power plants, hot steam and/or water is obtained from the deeper Earth layers instead of burning any fuel. Production well is used to draw hot water and/or steam from deeper layers. This mixture is separated by the separator in order to get the dry steam. Through a steam governor, a steam turbine is rotated by this high-pressure and high-temperature steam. Since the steam turbine is coupled to an electric generator, the mechanical steam power is converted into electric power. The output voltage of the generator is increased by a power transformer. The high voltage output of the power transformer can then be connected to the high-voltage transmission network. The steam loses its temperature and pressure after it goes through the steam turbine. Thus, the output flow of the steam turbine is condensed in the condensers. Condensed water is cooled down through the cooling tower, and cool water helps to condense the low-pressure/low-temperature steam in the condenser. The cooled water is then injected back to the inner Earth layers to get hot again. If the geothermal field is rich of hot water reservoirs, this cooled but still relatively warm water can be used for other heating purposes.
Geothermal energy is an abundant, secure, reliable, and renewable source of energy. It has high availability and capacity factor in comparison with other renewables. It is not a source of pollution for the environment; that is, their CO2 emissions are less than 0.2% of the cleanest fossil-fuel-fired power plant, SO2 emissions are less than 1%, and particulate emissions are less than 0.1%. It has an inherent energy storage capability and requires very small land area for establishment [186].
Geothermal power plants can be classified into three main generation technologies: dry-steam power plant, flash-steam power plant, and binary-cycle power plant.
Dry-steam power plants are the most common geothermal power plants since they are simple and cost-effective. These power plants are applicable to the geothermal fields where the geothermal steam is not mixed with water. In this method, production wells are drilled down to the aquifer to get superheated and pressurized steam. This steam is brought to the surface at high speeds. When the expanding steam passes through the turbine, the generator generates electricity [189,190]. The low-pressure steam output from the turbine is ventilated to the atmosphere in simple power plants. However, exhaust steam from the turbine is condensed in more complex power plants. The condensate can be reinjected to the reservoir by the injection wells, and/or it can be used as makeup cooling water.
Flash-steam power plants use a flash-steam technology where the hydrothermal source is in liquid form. This fluid is sprayed into a flash tank that is at a much lower pressure than the fluid. Therefore, the fluid immediately vaporizes rapidly into steam [189,191]. This generated steam is used to rotate the steam turbines that are coupled to electric generators. The production well is kept under high pressure in order to prevent the geothermal fluid flashing inside the well [186]. Instead of using a single flashing system, dual-flashing systems are also used. The brine from the high-pressure steam is piped into a low-pressure separator/flash tank where the pressure is additionally reduced to generate lower-pressure steam in the dual-flash systems. In order to generate additional electric power, this lower-pressure steam is piped into a lower-pressure stage of the turbine. The steam exhaust from the high and low pressure turbines is condensed. Just like the dry-steam plants, the condensate is then used as makeup cooling water or reinjected to the reservoir.
Although the dual-flash power plants have higher capital cost, they have higher thermoelectric efficiency. Resource characteristics, power plant output, thermodynamic and economic factors, and equipment availability are the factors affecting the decision to build and operate a single-flash or dual-flash geothermal power plants [192]. Generally, dual-flash system is preferred if the fluid temperature is between 175 and 260°C, while single-flash systems are efficient enough for the fluid temperatures higher than 260°C.
Binary-cycle power plants are preferred when the geothermal resource is insufficiently hot to produce steam. Sometimes, the resource may have other chemical components causing impurities, and flashing may not become possible [186,193]. In these cases, binary-cycle power plants are preferred. In binary-cycle geothermal power plants, isobutene, isopentane, or pentane is used as the secondary fluid that has a lower boiling point than water. Since a separate working fluid is used, the cycle is called “binary.” The geothermal fluid (water) is passed through a heat exchanger in order to heat up the secondary fluid. Secondary fluid vaporizes and expands through the turbines that are coupled to electric generators. After passing through the turbines, the working fluid is condensed and recycled for the next cycle. Moreover, the fluid remaining in the tank of flash-steam plants can be reutilized in binary-cycle plants. In a closed-cycle system, all of the geothermal fluid is injected back to the ground. Usually, binary-cycle plants are more efficient than the flash-steam plants in low to moderate temperatures of geothermal fluids. Furthermore, corrosion problems are avoided since a pure working fluid is used.
23.3.7 Nuclear Power Plants
In nuclear power plants, energy is extracted from atomic nuclei by the controlled nuclear reactions. There are several available methods such as nuclear fission, nuclear fusion, and radioactive decay. The most common method is the nuclear fission. Similar to the conventional fossil-fuel-fired power plants, nuclear reactors generate heat in order to produce steam. However, unlike many conventional thermal power plants, nuclear power plants convert the energy released from the atoms' nucleus generally via nuclear fission, instead of burning fossil fuels. This energy is used for steam production that is utilized to operate the turbines that are coupled to electric generators. In this way, the mechanical work of the high-pressure steam is converted into electricity [194,195].
The fission of an atom occurs when a relatively large fissile atomic nucleus such as uranium-235 or plutonium-239 absorbs a neutron. The atom is then split by the fission into two or more smaller nuclei with kinetic energy, gamma radiation, and free neutrons [194]. Other fissile atoms may absorb a portion of these neutrons and create more fission, which release more neutrons, and so on [195]. By using neutron moderators and neutron poisons, this nuclear chain reaction can be controlled in order to adjust the potion of neutrons that will cause more fission. Manual or automatic control systems are used for this purpose or to shut down the reactor if unsafe conditions are detected [196].
Heat generation by the reactor core from fission involves several stages. The kinetic energy of the fission products is converted into thermal energy when a collision happens between the nuclei and nearby atoms. The reactor absorbs some of the gamma radiation produced during fission in the form of heat. Neutron absorption activates some materials, and the radioactive decay of fission products produces heat. Even after the reactor is shut down, this decay heat source may remain for some time. A nuclear reaction can generate heat power that is 1,000,000 times that of the equal mass of coal.
After the fission process, the heat released from the reactor is removed by a cooling system. This heat is conveyed to another part of the power plant, in which the thermal energy is utilized to generate electricity. The hot coolant in general is used as the heat source for a boiler. The boiler generates the pressurized steam that mechanically drives the steam turbines. The steam turbines rotate the electric generators [197]. A simple operating schematic of a nuclear power plant is depicted in Fig. 23.43.

By utilizing different coolants and fuels and integrating different control methodologies, many different reactor designs can be accomplished. In order to meet a specific need, some of these designs can be employed for various applications. Space and naval applications are some of these specific applications. In these applications, generally highly enriched uranium is used as the fuel that increases the reactor's power density and efficiency [198]. Currently, researchers are investigating new nuclear power generation techniques, known as the generation IV reactors. These new designs will have the possibility to offer cleaner and more secure fission reactors with less risk of the proliferation of nuclear weapons. New designs such as ESBWR offer passively safe plants, and other designs that are believed to be almost foolproof are being pursued or are available to be built [199]. In the near future, it is expected that the fusion reactors will be viable, which will reduce or eliminate many safety risks associated with nuclear fission [200].
23.3.8 Fuel Cell Power Plants
Since the beginning of twenty-first century, fuel-cell technology has been rapidly developed and has shown an invasive improvement for the applications ranging from portable electronic devices to vehicular power systems and MW size power plants [201–203]. Fuel cells are promising future energy conversion devices due to their high efficiency, excellent performance, low or zero emissions, and wide application area.
Fuel-cell power plants are electrochemical devices that produce electric energy directly from a chemical reaction. Fuel cells use fuel on the anode side and oxidant on the cathode side. The chemical reaction occurs on the electrolyte. The reactants, that is, fuel and oxidant, flow into the cell, while the reaction product (water) flows out of the cell. Many fuel and oxidant types can be used for fuel cells. Generally, hydrogen as the fuel and oxygen as the oxidant, from the air, can be used. On the other hand, alcohols and hydrocarbons can be other fuel types for different fuel cells, while other oxidants may be chlorine and chlorine dioxide [204–206].
Just like a battery, a fuel cell is composed of an electrolyte and a pair of electrodes. However, unlike the batteries, the reactants are continuously replenished during the operation; therefore, the cell is not required to be recharged. Ideally, fuel cells operate and continue to produce energy as long as the reactants are appropriately supplied to the anode and cathode sides.
There are many kinds of fuel cells categorized by their electrolyte type. Most common fuel-cell types are as follows:
• Proton exchange membrane fuel cells (PEMFCs)
• Phosphoric acid fuel cells (PAFCs)
• Direct methanol fuel cells (DMFCs)
• Solid oxide fuel cells (SOFC)
• Molten carbonate fuel cells (MCFCs)
PEMFCs are generally used for residential, vehicular, and portable applications. Solid electrolyte structure reduces the corrosion, they can operate at low temperature, and they have quick start-up and faster response times. PAFCs are typically used for transportation, heating, and electric utility applications. They may reach high efficiency points in electric cogeneration applications [207,208]. Currently, DMFCs are considered as a replacement alternative for batteries for small portable devices' power requirements. DMFC can be considered advantageous since methanol can be used directly without any reformer or fuel processor. However, they have relatively low efficiencies and slow response times since the reaction rate for the methanol is slow on presently available catalysts. On the other hand, DMFCs can be competitive with batteries since the simplicity, high storage density, and liquid methanol portability may compensate the relatively low efficiency [207]. MCFCs and SOFC are generally used as large power plants for electric utility applications. Both the technologies have higher efficiencies, fuel flexibility, and inexpensive catalysts [208]. However, they operate at really high temperatures generally between 600 and 1000°C. This high-temperature issue avoids these two fuel-cell technologies to be best candidates for portable or vehicular applications.
Especially, proton exchange membrane fuel cells are considered to be one of the most promising fuel-cell technologies among these next-generation fuel-cell power plants. This is due to their high efficiency and compact structure [209,210]. The operating principle of PEMFCs is focused in this section.
The operating principle along with the basic components of a PEMFC is presented in Fig. 23.44.

After the fuel is supplied to the anode side, the fuel is oxidized resulting in releasing electrons. The anode reaction for a fuel cell can be expressed as
These released electrons are transported to the cathode side through an external circuit. The hydrogen protons are traveled through the proton exchange membrane to the cathode side. The oxidant (i.e., oxygen) is reduced at the cathode side, using the electrons coming from the external circuit. Therefore, the cathode reaction is
The hydrogen protons travel through the membrane and balance the flow of electrons through the external circuit. Therefore, the overall reaction equation becomes
A typical single fuel cell has a theoretical output voltage of 1.2 V. They generate ideally 0.6 A/cm2. In order to reach higher voltage outputs from a fuel-cell system, cells are connected in series in the form of a string. For higher current outputs, the cells or the cell strings should be connected in parallel. Unfortunately, the output voltage of a fuel cell or a fuel-cell system decreases as the current drawn from the fuel cell is increased. This voltage drop at the fuel-cell output is due to the ohmic, activation, and concentration losses [211].
A typical current-voltage characteristic curve of a fuel cell is shown in Fig. 23.45, which is also known as the polarization curve.

The output voltage of a fuel cell is less than its theoretical value even in the open-circuit conditions. This is due to the fact that the open-circuit voltage is calculated based on the ideal burning enthalpy of the hydrogen. The activation loss is generally effective at the low current densities. Activation loss is due to the electrode kinetics in which the electrochemical reaction of hydrogen and oxygen is slow. Activation loss causes a nonlinear voltage drop as the current starts to be drawn from the fuel cell. Ohmic losses are due to the electron flow through the electrolyte and electrodes and the equivalent resistance of the external circuit. Ohmic losses are directly proportional to the current density, and they increase linearly as the current increases. Concentration losses are due to the inability of maintaining the initial fuel concentration on the electrodes. Fuel and oxidant should be supplied sufficiently and continuously in order to meet sustained load demands. If the current is more than a certain value, a fuel cell fails to meet the new power demand, and the output voltage dramatically decreases. Therefore, this loss is quite severe at the high current densities.
Due to the polarization and current-voltage characteristics of the fuel cells, power conditioning devices such as dc/dc and/or dc/ac converters are required to maintain a fixed and stable dc voltage for the load bus. The power conditioning is also useful for converting the fuel-cell output to an appropriate magnitude and type. Power conditioning unit (PCU) not only controls the fuel-cell output voltage but also delivers a high power factor in grid-connected applications. PCU can reduce or eliminate the harmonics and help them operate effectively under all conditions. A fuel-cell power plant operating together with a PCU is presented in Fig. 23.46.
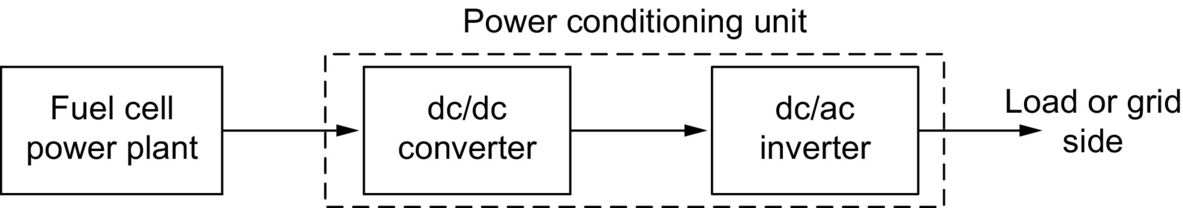
In the stationary or vehicular applications, a fuel-cell power plant may not be sufficient to satisfy all of the load demands [210]. Especially during transient load changes or peak demand periods, a fuel cell needs to be operated with an auxiliary power device such as battery packs or ultracapacitors. By operating fuel cell cascaded with batteries and/or ultracapacitors, steady-state, peak power demands, and transient load changes can be controlled more efficiently. In the topology of Fig. 23.47, the fuel-cell power plant is operated with auxiliary power devices.

23.4 Conclusions
In order to meet the future energy requirements, the energy should be generated and utilized wisely. Increasing the demand for energy, decreasing conventional fossil-fuel energy sources, and environmental concerns are driving forces toward renewable energy sources. However, the conventional sources will be utilized until modern, clean, and renewable technologies replace them. Therefore, a comprehensive strategy that supports a diversity of resources over the next century should be developed. Sustainable and long-term energy solutions in numerous forms are required to restructure the future's increasing energy demand.