
Now you will convert the matches file you generated in Chapter 2 to a format suitable for answering the proposed questions.
- Search on your disk for the file you created in Chapter 2, or download it from the Packt website.
- Create a new transformation and read the file by using a Text file input step.
- With a Split Fields step, split the
Resultfield in two:home_t_goalsandaway_t_goals. (Do you remember having done this in chapter 3?) - From the Transform category of steps, drag a Row Normalizer step to the canvas.
- Create a hop from the last step to this new one.
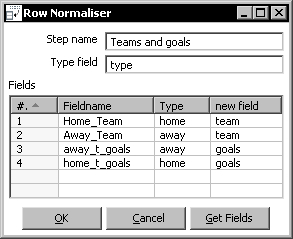
- Double-click the Row Normalizer step to edit it and fill the window as follows:
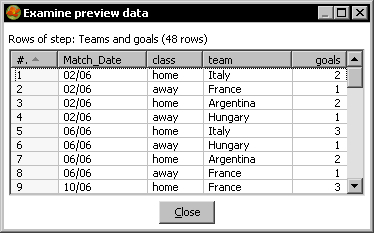
- With the Row Normalizer selected, do a preview. You should see this:
You read the matches file and converted the dataset to a new one where both the home team and the away team appeared under a new column named team, together with another new column named goals holding the goals converted by each team. With this new format, it is really easy now to answer the questions proposed at the beginning of the section.
The Row Normalizer step modifies your dataset, so it becomes more suitable for processing. Usually this involves transforming columns into rows.
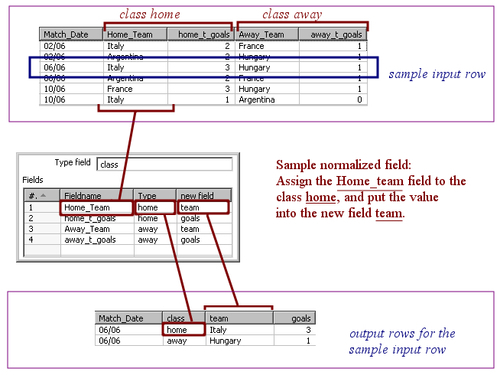
To understand how it works, let's take as example the file from the tutorial. Here is a sketch of what we want to have at the end:
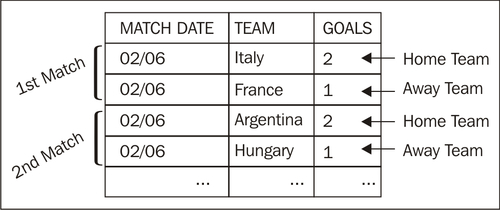
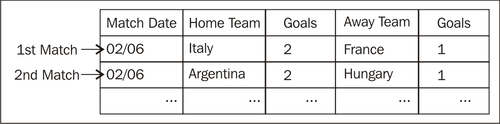
What we have now is this:
Now it is just a matter of creating a correspondence between the old columns and the new ones.
Just follow these steps and you have the work done:
|
Step |
Example |
|---|---|
|
Identify the new desired fields. Give them a name. |
|
|
Look at the old fields and identify which ones you want to translate to the new fields. |
|
|
From that list, identify the columns you want to keep together in the same row, creating a sort of classification of the fields. Give each group a name. Also, give a name to the classification. |
You want to keep together the fields Likewise, you create a group named Name the classification as |
|
Define a correspondence between the fields identified above, and the new fields. |
The old field The old field The old field The old field |
Transcript all these definitions to the Row Normalizer configuration window as shown below:
In the fields grid, insert one row for each of the fields you want to normalize.
Once you normalize, you have a new dataset where the fields for the groups you defined were converted to rows.
The number of rows in the new dataset is equal to the number of groups defined by the number of rows in the old dataset. In the tutorial, the final number is 24 rows x 2 groups = 48 rows.
Note that the fields not mentioned in the configuration of the Row Normalizer (Match_Date field in the example) are kept without changes. They are simply duplicated for each new row.
In the tutorial, every group was made by two fields: Home_Team and home_t_goals for the first group, and Away_Team and away_t_goals for the second. When you normalize, a group may have just one field, two fields (as in this example), or more than two fields.
The Row Normaliser and Row denormalizer steps you learned in this chapter are some of the PDI steps which, rather than treating single rows, operate on sets of rows. The following table gives you an overview of the main PDI steps that fall into this particular group of steps:
|
Step |
Purpose |
|---|---|
|
Group by |
Builds aggregates such as |
|
Univariate Statistics |
Computes some simple statistics. It complements the Group by. It has less capabilities than that step but provides more aggregate functions such as |
|
Split Fields |
Splits a single field into more than one. Actually it doesn't operate on a set of rows, but it's common to use it combined with some of the steps in this table. For example: You could use a Group by step to concatenate a field, followed by a Split Fields step that splits that concatenated field into several columns. |
|
Row Normaliser |
Transforms columns into rows making the dataset more suitable for processing. |
|
Row denormaliser |
Moves information from rows to columns according to the values of a key field. |
|
Row flattener |
Flattens consecutive rows. You could achieve the same by using a Group by to concatenate the field to flatten, followed by a Split Field step. |
|
Sort rows |
Sorts rows based on field values. Alternatively, it can keep only unique rows. |
|
Split field to rows |
Splits a single string field and creates a new row for each split term. |
|
Unique rows |
Removes double consecutive rows and leaves only unique occurrences. |
For examples on using these steps or for getting more information about them, please refer to Appendix C, Quick reference: Steps and Job Entries.
Extend the transformation and answer the questions proposed at the beginning of the section:
- How many teams played?
- Which team converted most goals?
- Which team won all matches it played?
If you are not convinced that the normalizer process makes the work easier, you can try to answer the questions without normalizing. That effort will definitively convince you!
Consider the output of the first Time for action section in this chapter. Generate the following output:
You have two options here:
- To modify the tutorial by sending the output to a new file. Then to use that new file to do this exercise.
- To extend the stream in the original transformation by adding new steps after the Row Denormalizer step.
After doing the exercise, think about this: Does it make sense to denormalize and then normalize again? What is the difference between the original file and the output of this exercise? Could you have done the same without denormalizing and normalizing?
Take the contest file and generate the following output, where the columns represent the minimum, maximum, and average score given by every judge:
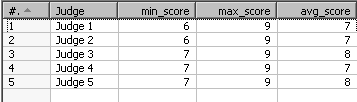
This exercise may appear difficult at first, but here's a clue: After reading the file, use a Group by step to calculate all the values you need for your final output. Leave the group field empty so that the step groups all rows in the dataset.