
In this first section, we will go back to our AIController script, which we had already created in the previous chapter. However, this AIController script needs a little more tweaking to make our game frame rate higher.
Before we start tweaking the AIController script, we need to see the frame rate result in our game.
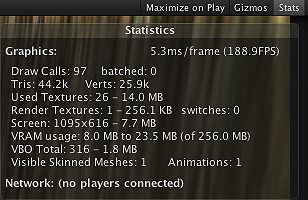
First, click Play to run the game and open the Statistics window by clicking on the Stats option on the top-right corner of the Game view to bring up the Statistics window. In this window, you can see many parameters that are very useful if you are trying to debug your game and see how much Frame Rate, Draw Calls, Tris (triangles), Verts (vertices), Textures, and Memory the game is using or running on right now.
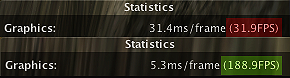
When the game is running, you will see that often the frame rate (FPS) is not stable. It will go from more than 120 FPS down to 20 FPS, which will cause the problem of lagging while we are playing the game.
You might see the different frame rates, as shown in the following screenshot, but you should be able to notice the rise and drop in the fast rate regardless of how fast or slow the FPS is:
Now, we know that the FPS is not stable and we need to fix it, but how can we know where the problem came from, what is its actual cause? You will need to play through the game and see when the FPS is going down.
First, let's think about the problem. If you look closely, you will observe that the FPS keeps fluctuating. Hence, we can assume that this is not a graphics or memory problem, as that would have caused the game to crash or the FPS to remain consistently low.
Next, let's take a look at the issue that might have caused the problem. It might be our player script or the AI script. As we haven't even controlled our character, it is likely that the problem is in our AIController script. In order to verify this, let's move our character to a position where we can see our AIs.
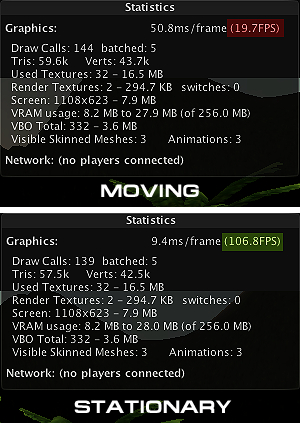
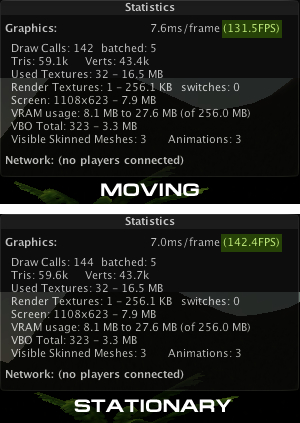
In the Statistics window, we see something wrong. The problem is that every time the AIs start moving, the FPS decreases. On the other hand, when the AIs stop moving, the FPS goes back to normal:
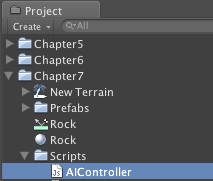
Now we know that our problem comes from something inside the AIController script, which should be the function that we call while the AI is moving. So, open the
AIController script, which is located in the Chapter7/Scripts folder in the Project view, as shown in the following screenshot:
Now, double-click it, open the script and take a look at the Update() function, which is the core function to control our AI.
Inside the Update() function, we know that the problem arises only when the character moves (which will be when the AI is not stopping or aiming).
Let's take a look inside if (!b_isAiming) {......}; we will see nothing different from the CharacterControl script, which we already used to control our character in Project 4, The Hero/Heroine Part II—Animation and Controls, so it shouldn't be a problem, right? However, one part of the script that we have changed to make our AI jump instead of getting the Input key is the Jump(_direction : Vector3) function
.
In the Jump(_direction : Vector3) function
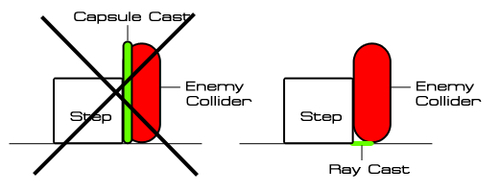
, you will see that we have used Physics.CapsuleCast to check for the AI to jump if the step is in front of it. As we discussed in the last chapter, Physics.CapsuleCast will cast the capsule collision in the given direction (which is the _direction that gets passed from Jump function) to check if the capsule hit something.
Now, just think about it—do we really need to cast the capsule checking for the step and make the AI jump? Can't we cast only one ray to check for it?
The answer is "Yes. We can do it".
So, let's replace some old code in the Jump() function so that it looks similar to the following code:
 //Make character Jump
public function Jump (_direction : Vector3) : boolean {
  //Checking for Jumping if the next y position is different than the current y position
  var hit : RaycastHit;

   //Optimization
  var v3_leg : Vector3 = transform.position + controller.center + Vector3.up * (-controller.height*0.5);
  var f_distance : float = controller.radius * 2;
  if ((Physics.Raycast(v3_leg, _direction, hit, f_distance)) && (c_collisionFlags & CollisionFlags.Sides)) {
    if (hit.transform.tag == "Wall") {
      return true;
    }
  }
  return false;
}
From the preceding code, we basically change the checking from the capsule cast to the ray cast by drawing the line from the bottom of our AI in the given direction, which is much faster because we only draw one line and not a whole capsule.
Now, we click Play and check our FPS to see whether the problem has been fixed by checking the Statistics window while the AI is moving and is stationary.
We can see that right now the FPS is a lot more stable, as shown in the following screenshot:
What we have done here is optimize our AIController script to increase the FPS by using the Physics.Raycast instead of Physics.CapsuleCast to speed up the checking process of making the AI jump.
As we have seen in this chapter, we had to go through a lot of checking and coding to be able to track down and see which part of the game decreases the FPS. We were aware of the problem because we were coding it. However, if we didn't create the whole game or we use somebody else's code, it might become a nightmare to track down which section is causing the problem.
In Unity Pro, it is easier to solve or find the problem within our code by using the Profiler to debug our game. The way to see it is by going to Window | Profiler to open the Profiler view; you will see two sections in this window.
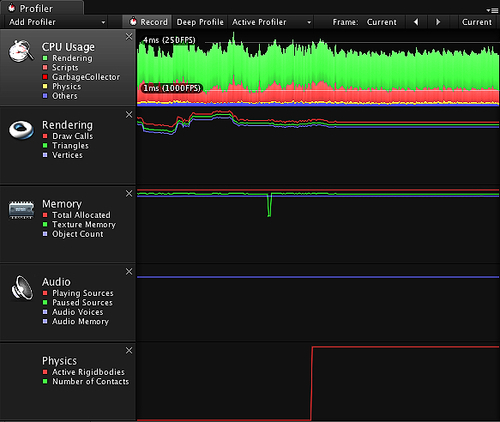
The first part is the graph for CPU Usage, Rendering, Memory, Audio, and Physics, as shown in the following screenshot:
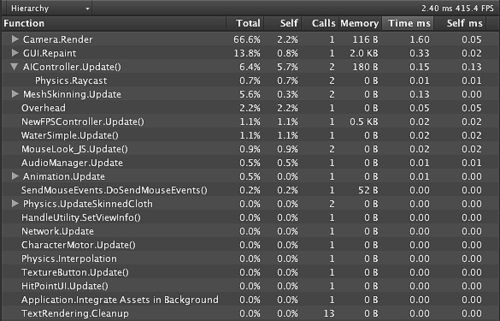
The second part will show us the functions and scripts that relate to the CPU Usage, Rendering, Memory, Audio, and Physics, while we are playing this scene, as shown in the following screenshot:
By opening the Profiler, we will be able to see the performance and the reason for the game to slow down. If we use the old AIController script and open the Profiler view, we will be able to see the cause that affects the performance of this game right away, as we can see in the following screenshot:
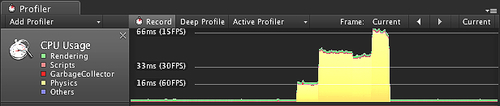
From the preceding graph, we can see that the yellow graph—which represents the Physics—is very high. Then, we can also see the second section, which will show the function in the script that causes the FPS issue, as shown in the following screenshot:
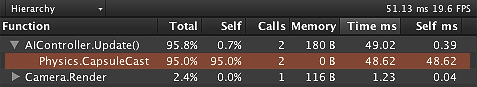
From the preceding screenshot, we will see the line Physics.CapsuleCast inside AIController.Update() causes 95.0% of the CPU usage, which is exactly what we are looking for.
Note
You can get more details on how to use the Profiler from the following URL:
http://unity3d.com/support/documentation/Manual/Profiler.html.