
After all the preconfigurations, installations, and setting up of virtual machines, everything is up and running normally. However, what you really need to consider is what is normal. What is the regular performance and system utilization for your physical and virtual servers?
Logged monitoring will help you to answer the question, measure realistic conditions, and identify the needs of servers and hardware upgrades, optimization, and tunings using trend analysis. This is an example of what you can get using baselines. A baseline is the level of system performance that you decide is acceptable. Normally, they are decided before deployment during the planning phases.
Using data collector sets from Perfmon, you can get realistic and advanced trend information and create baselines that can start and stop automatically based on your schedule.
This recipe will show you how to use Perfmon to create baselines for your physical and virtual machines.
Baselines must track the server activities during a specific period of time. You can create daily, weekly, monthly, or any other schedule you need. Before you start, decide what you want to monitor, such as processor, memory, disk, and network, and also for how long it will be monitored.
The following steps will show you the default system data collector sets and how to create user-defined collector sets:
- To use the default data collector sets, launch the Start menu, type
performance monitorand press Enter. - In the Performance Monitor window, under Performance, expand Data CollectorSets and click on System, as shown in the following screenshot:

Performance Monitor – Data Collector Sets
- There are two default data collector sets named System Diagnostics and System Performance. To start either of them, right-click on it and select Start.
- To see the results, expand Reports | System and select the report you want to open.
- To create a new data collector set, right-click on User Defined under Data Collector Sets, select Data Collector Set, and click on New.
- In the Create new Data Collector Set window, type a name and select Create manually (Advanced), and click on Next.
- On the What type of data do you want to include? screen, select the data type you want to use and click on Next.
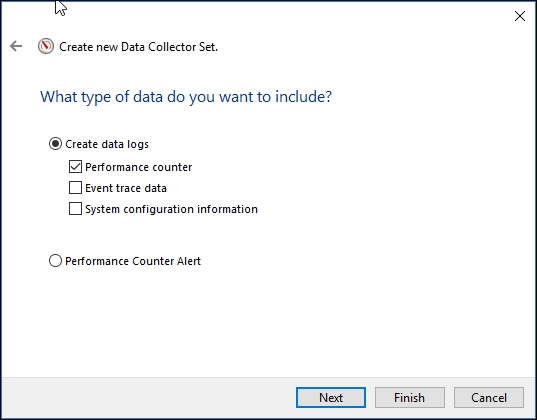
Performance Monitor – Creating a Data Collector Set
- In the new window, select the computer from which you want to get the data for remote monitoring, select the counters and instances you want to add and click on Add, as shown in the following screenshot. When finished, click on OK.
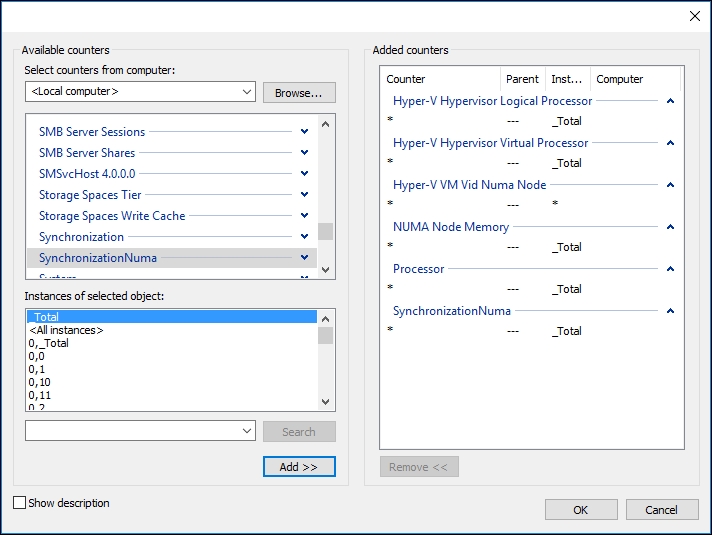
Performance Monitor – Adding Counters to a Data Collector Set
- Under Performance Counters, under Sample Interval and Units, put the number and units you want to use to record the selected counters.
- Check the selected counters and click on Finish, as shown in the following screenshot.
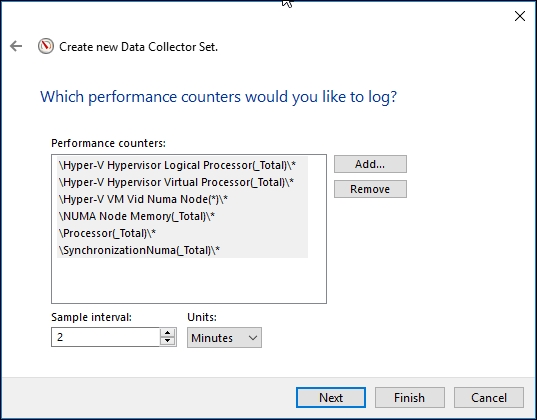
Performance Monitor – Selecting Performance Counters to Log
- After creating the new collector set, right-click on it under User Defined and click on Properties to change its options.
- In the properties window, you can add a schedule to run the baseline automatically, create a stop condition (as shown with the example in the following screenshot), or change other options using the General tab, Directory, Security, Schedule, Stop Condition, and Task.

Performance Monitor – Data Collector Set Properties
- After running the data collector set, to check the collected data, navigate to Reports | User Defined in the Performance Monitor window and open the folder for the collector set you created.
- The report will be shown in the right-hand pane. Use the toolbar and the counter list to view and change the results window, as shown in the following screenshot:
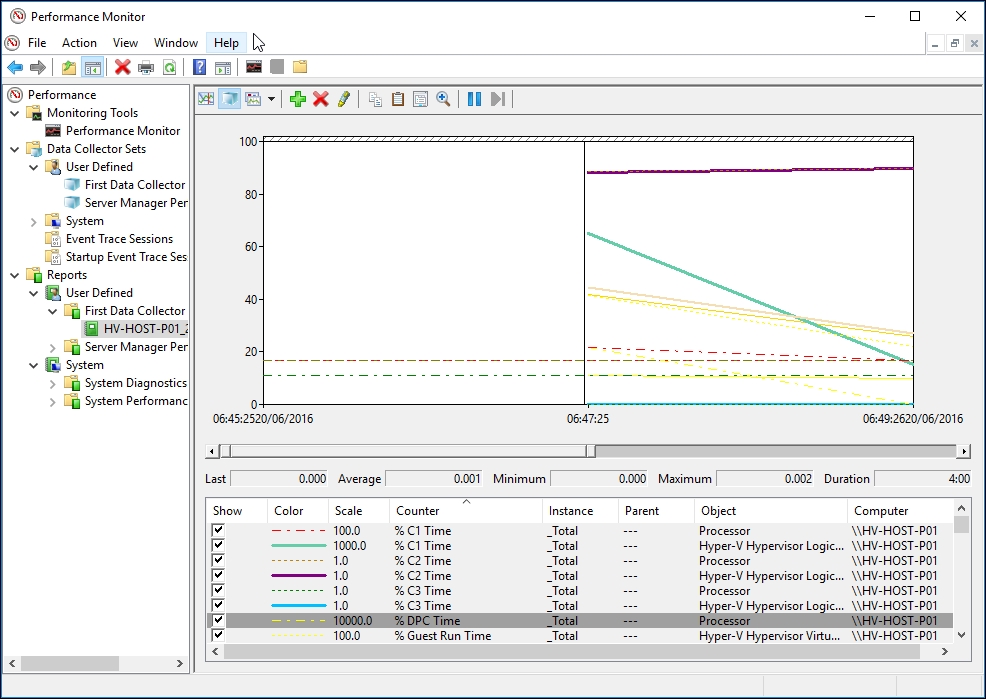
Performance Monitor – Collected Data
On Windows Server, Perfmon is the only built-in tool that can be used for logged monitoring. It comes with two system-collector sets that can be used to get advanced reports showing system diagnostics and system performance.
Under User Defined, you can create your own collector sets, based on the application or the hardware you want to monitor.
For virtual environments, you can only use the host partition to analyze all the performance trends, but in some exceptions, a monitoring method, within particular virtual machines, is required.
Hyper-V has specific counters that let you know everything that is happening in the virtualization stack, virtual machines, and host resources. Some counters also have instances that can be triggered to monitor something more specific. For example, when the Logical Disk counter is being used, you can select which disk (instance) you want to add.
Due to a high number of counters, the following list shows only a small selection of Hyper-V counters based on the subsystem that will be monitored. They can be used in conjunction to also monitor parent and child partitions.
There is no standard for creating a baseline; each environment is different from the other. You will need to identify which resources need to be monitored and then create your own monitoring plan. The number of counters being monitored and the duration is also very important. If you have a data collector set with lots of counters, which uses small intervals of time, you might experience performance, storage, and network issues. Make sure the interval used is larger for longer monitoring windows. For instance, to monitor a server for one day, you can use a 10-minute interval and for one week of monitoring, a 1-hour interval.
Note
In case you don't have a plan and just want to run a baseline to track and analyze your system growth, you can create four baselines using the counters from the previous lists: processor, memory, disk, and network.
Remember that these counters are just the normal ones for each subsystem, but you have many more options that can be used for advanced monitoring scenarios.
Now, with logged monitoring in place, you can analyze, investigate, and evaluate your existing environment, finding the normal baseline and using it to track any anomaly easily. The baseline results will also help you to identify when a tuning or an upgrade is necessary.