System monitoring is the process of determining and finding problems in any of your servers, either physical or virtual.
VM Monitoring is a great assistant for virtual machine monitoring in clustered environments and helps to detect whether a virtual machine is running in a critical state. It will allow you to check the health of the VM service at the host level, identify issues using events and status messages. VM Monitoring also enables the host to start a task to solve the problem in a proactive way, with no user interaction. In other words, it will check whether something is wrong, and if necessary, it will try to fix the problem automatically.
This recipe will show you how to prepare the virtual machine and the Management OS to use VM Monitoring.
There are some prerequisites that you need to note before you start. The first thing is that VM Monitoring is only available on virtual machines running on a cluster. All the host computer configurations are done through the Failover Cluster Manager console.
The virtual machine must be a part of the same domain as the Management OS, and the user used to administer Failover Clustering must be a member of the local administrator's group in the VM.
Last but not the least; VM Monitoring is only available on virtual machines that run Windows Server 2012 and higher versions.
The following steps will demonstrate how to prepare the virtual machine to be monitored by VM Monitoring, how to enable it from the host so as to monitor a service, how to monitor Event Viewer entries within the VM, and how to check the VM Monitoring results:
- To configure the VM to be monitored using VM Monitoring, open the Failover Cluster Manager console from one of the cluster nodes (or a machine that has Failover Cluster Manager installed) by typing
cluadmin.mscon the Start menu. - In the Failover Cluster Manager window, expand your cluster, click on Roles, select the virtual machine that you want to prepare for use with VM Monitoring, and click on Connect in the right-hand pane.
- Make sure the VM is started and log in using a local administrator account.
- To create a Windows Firewall exception, launch the Start menu and type firewall. In the right-hand pane, under Search select Windows Firewall.
- On the left-hand pane, click on Allow an app or feature through Windows Firewall.
- Under Allow apps to communicate through Windows Firewall, select Virtual Machine Monitoring and select the networks you are connected with, as shown in the following screenshot:

Windows Firewall – Configuring VM Monitoring
- To configure the recovery service action on the service that will be monitored, launch the Start menu and type
services.mscto open the Services console. - In the Services console, in the service list, double-click on the service you want to monitor and click on the Recovery tab.
- Select the actions for First failure, Second failure, and Subsequent failures, as shown in the following screenshot:

Configuring VM Monitoring – Recovery Options
- When finished, close all the windows and virtual machine connections.
- To configure VM Monitoring to monitor a service, from the Management OS, open the Failover Cluster Manager console again, right-click on the virtual machine you configured to enable VM Monitoring, select More Actions, and click on Configure Monitoring.
- In the Select Services window, select the service you want to monitor and click on OK, as shown in the following screenshot:
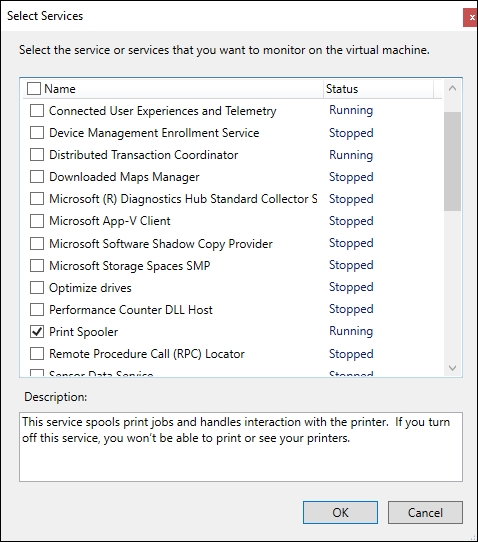
Configuring VM Monitoring – Selecting Services to Monitor
- If you want to add a service that is not on the service list, type the following command from one of the failover cluster nodes, changing 2012R2 to the virtual machine name and
MyApplicationto the service name you want to add:Add-ClusterVMMonitoredItem –VirtualMachine 2012R2 –Service MyApplication - To configure VM Monitoring, to monitor an event from Event Viewer, open the virtual machine connection again.
- From the VM, open Server Manager.
- In the Server Manager window, click on Manage in the right-hand pane and click on Add Roles and Features.
- In the Add Roles and Features Wizard window, click on Next four times.
- In the Select features section, navigate to Remote Server Administration Tools |Feature Administration Tools | Failover Clustering Tools, and select FailoverCluster Modules for Windows PowerShell, as shown in the following screenshot. Click on Next and then Finish to start the installation.
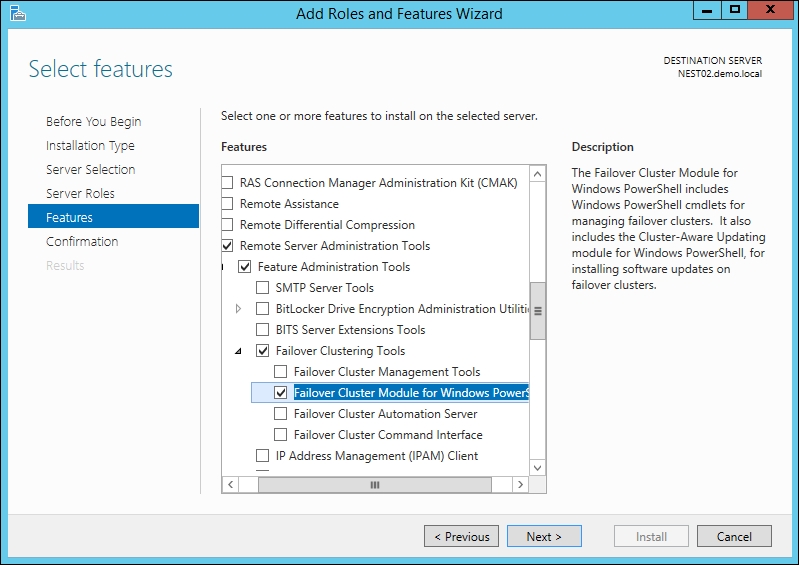
Adding the Failover Cluster Module for Windows PowerShell
- On the VM, open PowerShell and type the following command by replacing Application with the event log you want to monitor,
MyApplicationwith the event source you will use and123with the event ID VM Monitoring will monitor:Add-ClusterVMMonitoredItem –EventLog "Application" –EventSource "MyApplication" –EventID 123 - To change the default action triggered on the host computer when one of the monitoring resources is alerted, open Failover Cluster Manager, select the virtual machine in Roles, and click on the Resources tab at the bottom.
- In the Resources tab, right-click on the virtual machine and click on Properties.
- In the properties window for the virtual machine, select the Policies tab and configure the response to resource failure options. The default configuration, which is shown in the following screenshot, will attempt to restart the virtual machine if one of the configured VM Monitoring is triggered. If the restart is unsuccessful, the VM will failover to another node in the cluster.
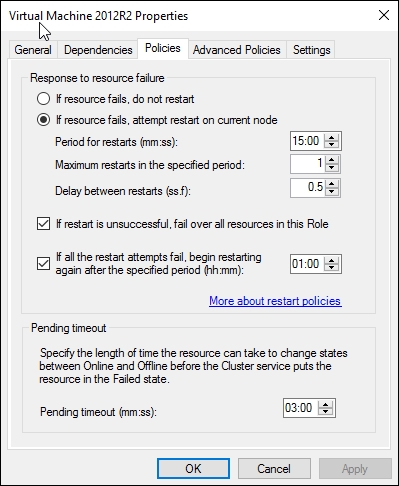
Adding the Failover Cluster Module for Windows PowerShell
- To check the virtual machine monitoring status, select the virtual machine in Failover Cluster Manager and check the status details.
- If the virtual machine has triggered one of the monitored options, a status showing Running (Application in VM Critical) will be displayed.
- To check the status on all virtual machines using PowerShell, type the following command from one of the nodes that is a member of the cluster:
Get-ClusterResource | fl StatusInformation - To check the virtual machine status using Event Viewer, open Event Viewer in one of the failover cluster nodes.
- In the Event Viewer window, expand Windows Logs and click on System. Click on Event ID to list events by ID, and double-click on the event with the ID 1250:
VM Monitoring can be enabled on every virtual machine with Windows Server 2012 or higher, running in a cluster, to monitor services and events from the host computer without the need to connect to the VM to check its status.
VM Monitoring requires that the virtual machine to be in the same domain as the host computer. It also needs the failover cluster administrator that is used to set VM Monitoring to be a member of the local administrator group within the VM.
After these prerequisites, a firewall exception to allow VM Monitoring must be created to allow the Management OS to connect to the VM.
When monitoring a service, you can specify what will happen within the VM in case of a service failure using the Recovery tab from the Services console. It allows three actions in a different order to be configured and can be used to automatically carry out an action such as sending an e-mail or running a script to solve the problem.
Using Failover Cluster Manager, you can enable VM Monitoring by selecting which services you want to monitor. In case the service is not listed, the Add-ClusterVMMonitoredItem command can be used from the host computer to add it to the list.
Although it is not available using the graphical interface, Event Viewer logs can also be monitored on your VMs using PowerShell. The necessary commands used to enable Event Viewer monitoring are a part of the Failover Clustering module and needs to be installed within the VM.
From the node members of the cluster where the VMs sit, you can use the status information from Failover Cluster Manager or use Event Viewer, searching for the event ID 1250 on the system log to check whether one of the monitored items was triggered.
When a problem is found by the cluster, the VM is restarted by default, and in case of failures, a failover process occurs. These failure actions can be changed through the virtual machine properties. Rather than carrying out an action, you can create an Event Viewer task to send an alert to the IT team with the status information, for example.
Although VM Monitoring is very handy, it is not enough. It is important to think about other monitoring tools that can give more details and alerts from your whole infrastructure, with reports and advanced features. A good example is System Centre Operations Manager, a server where you can centralize all monitoring data, which can include servers, applications, network devices, desktops, and many other components from different brands and providers.
In addition, this can all be combined with Log analytics in Operations Management Suite (OMS), which will allow you to gain a deeper insight into your environment. With OMS you can interact with real-time and historical machine data to quickly develop custom insights. OMS also has powerful search capabilities that enable ad-hoc root cause analysis and automated troubleshooting.