Sneaky Contrast Adjustments
Flattening a curve is usually harmful to an image because the detail in the area you are adjusting will be very difficult to see. You can often cheat, however, by analyzing the histogram to determine which areas of your image won't be harmed by flattening the curve. Because short lines in a histogram indicate shades that are not very prevalent in the image, those areas can often be flattened in a curve without noticeable degradation to the image. Flattening one part of the curve will allow you to make the rest of the curve steeper, which will increase the contrast of those areas and make the area appear to have more detail.
Here's how it works: While you're in the Curves dialog box, glance over at the Histogram palette and look for short, flat areas. When you find a flat area (not all images have them), choose Show Statistics from the side menu of the Histogram palette and then click and drag across that area in the Histogram palette, but don't release the mouse button (Figure 6.87). Now, look at the Level numbers that show up just below the histogram (if you don't see any numbers under the histogram, then choose Expanded View from the side menu of the Histogram palette). Next, release the mouse button and move your cursor around the Curves dialog box to see whether the numbers at the bottom are 0–100% or 0–255 numbers. If they are ranging from 0–100%, then click the arrows that appear in the center of the bottom gradient in the Curves dialog box to switch to the 0–255 numbering system. Now click in the middle of the curve and change the numbers that appear in the Input and Output fields at the bottom of the Curves dialog box to the first number you saw in the Histogram palette (Figure 6.88). Add a second point and do the same for the second number you saw in the Histogram palette. Finally, move the upper dot straight down and the lower dot straight up until the area between the two becomes almost horizontal (Figure 6.89). (Keep an eye on your image to see how flat you can get away with without screwing up the image.) That should increase the contrast across most of the image, while reducing contrast in those brightness levels that are not very prevalent in the image (Figures 6.90 and 6.91).
Figure 6.87. Drag across the extremely low areas of the histogram.

Figure 6.88. Add the first point and then enter the number from the Level area of the Histogram palette.

Figure 6.89. After adding the second point, move one point up and the other down to flatten part of the curve.
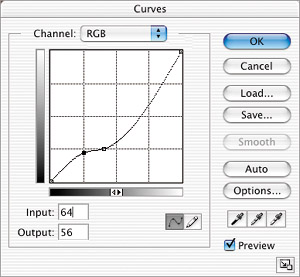
Figure 6.90. The original image. (©2005 Ben Willmore)

Figure 6.91. Result of applying the curve shown in Figure 6.89.

Just because I've decided to talk about the Histogram palette here in the Curves chapter, doesn't mean that I only use it when making that type of an adjustment. You can glance at the Histogram palette when performing any type of adjustment.
I don't adjust my images based solely on what the histogram is showing me. Instead, I adjust the image until I like its general appearance and then I look at the Histogram palette to look for signs that I might have gone too far. If I notice spikes on the ends, or a huge comb look, then I'll take a closer look at my image to determine if it's worth backing off from my adjustment. Who cares what the histogram looks like in the end—it's the visual look of your image that is most important. The histogram is just like that seatbelt warning light in your car—you're welcome to ignore it, but there's a reason it's on.