
Navigating through the different dashboards that come with Dynamics CRM 2011, as we did in Chapter 1, Viewing Dashboards, you have seen many different variations on how to view chart data. When too many charts are added to a dashboard, things can be a bit congested. In order to focus directly on one chart item and see things in a greater detail, there is an Enlarge the chart option.
Carry out the following steps in order to complete this recipe:
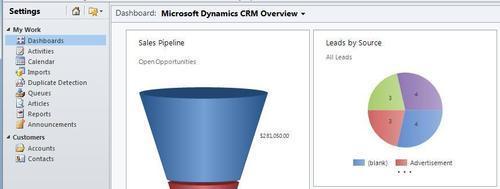
- Select the Dashboards link from the Workplace area.
- Select the Microsoft Dynamics CRM Overview dashboard as shown in the following screenshot:
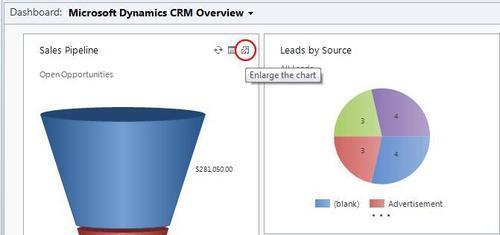
- Locate the Sales Pipeline funnel chart on this dashboard, hover with the mouse cursor over the upper right-hand corner of the chart, and a small three-item menu will appear. In the following screenshot, you can see the Enlarge the chart option highlighted:
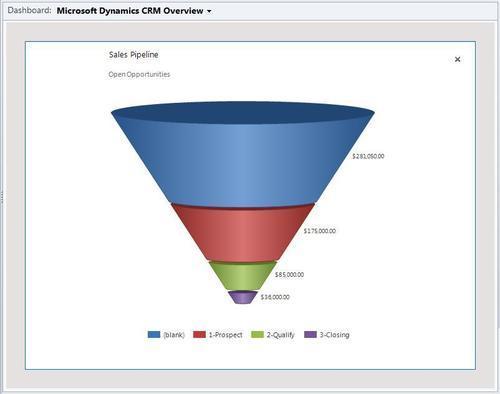
- Click on this menu option to enlarge this dashboard chart. The chart will expand to take all of the available space in the dashboard, hiding all other dashboard elements as shown in the following screenshot:
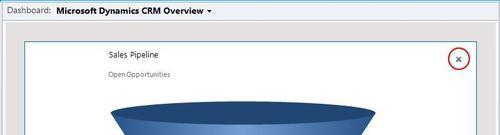
- In order to close the enlarged view of the chart, click on the x located in the upper right-hand corner of the dashboard, as highlighted in the following screenshot. You will return to the main view of the Microsoft Dynamics CRM Overview dashboard:
..................Content has been hidden....................
You can't read the all page of ebook, please click here login for view all page.