
The charts created and displayed in Dynamics CRM use the FetchXML syntax to query the underlying Dynamics CRM data source. Users can create comparison charts using the designer, but the comparisons are only based on one entity type. This recipe will create an Account SLA chart that shows how to manipulate the FetchXML query to pull and compare data from two different entities (Account and Case entities).
This recipe assumes that the reader has reviewed the earlier recipes and is familiar with how to export and import a chart from Dynamics CRM. This recipe will require you to add custom fields to the Account entity and make sure there are some active Case records related to active Accounts.
Carry out the following steps in order to complete this recipe:
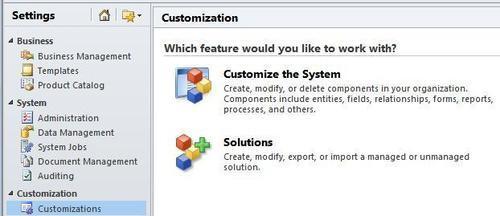
- Navigate to the Customization section in the Settings area of Dynamics CRM. Click on the Customize the System link to open the default solution, as shown in the following screenshot:
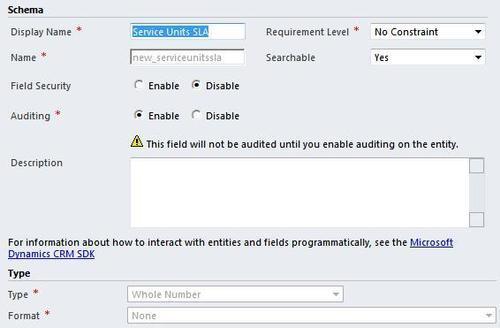
- In the Solution Explorer dialog, navigate to the Account entity and create a custom Service Units SLA field with the following properties:
Property
Value
Display Name
Service Units SLA
Name
new_serviceunitsslaRequirement Level
No Constraints
Type
Whole Number
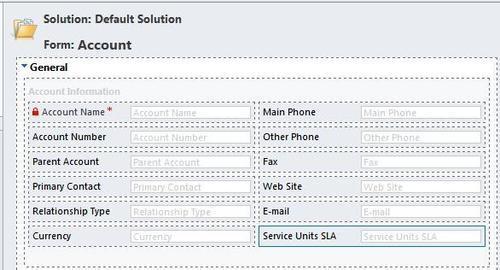
- Save this new field and add it to the Account form. Now, publish the changes:
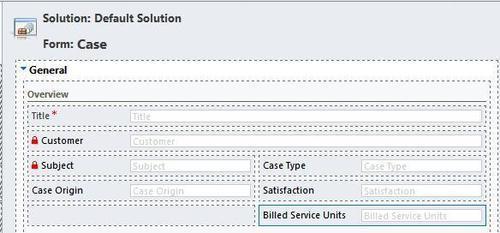
- In the Solution Explorer, navigate to the Case entity, edit the form, and make sure that the Billed Service Units field is being displayed. Note that the Billed Service Units field is a standard field included with Dynamics CRM, simply not shown on the Case form as part of the default deployment:
- Save the changes and publish the customizations.
- Now that the fields are ready and being displayed, you will need to edit the active Account records and provide values for the new Service Units SLA field. For this example, use values in the range of 7 to 10.
- After updating the Account records, open the active Case records and provide values for the Billed Service Units field. For this example, provide a range of numbers between 2 and 12. This will result in some Cases being below the SLA level and some being above the SLA level.
- We are ready to make the basic chart now. In the Solution Explorer dialog, navigate to the Case entity and create a new System chart using the following parameters:
Property
Value
View used for chart preview
My Active Cases
Name
Account SLA Performance
Chart Type
Column
Legend Entries (Series)
Billed Service Units (Sum)
Horizontal (Category) Axis Labels
Customer
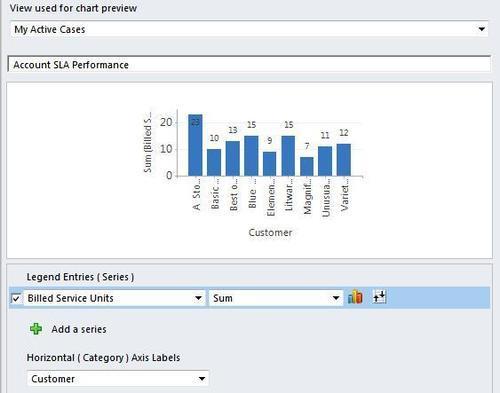
- Save the chart and export it to your local drive. We will modify it further in the next few steps.
- Once the chart is exported, open the Chart XML file in an XML editor such as Microsoft Visual Studio and locate the
<fetch>segment near the top of the file:<fetch mapping="logical" aggregate="true"> <entity name="incident"> <attribute groupby="true" alias="_CRMAutoGen_groupby_column_Num_0" name="customerid" /> <attribute alias="_CRMAutoGen_aggregate_column_Num_0" name="billedserviceunits" aggregate="sum" /> </entity> </fetch>
- Adjust the
<fetch>segment by adding a<link-entity>condition that pulls in data from the Account entity's Service Unit SLA field, shown as follows:<fetch mapping="logical" aggregate="true"> <entity name="incident"> <attribute groupby="true" alias="_CRMAutoGen_groupby_column_Num_0" name="customerid" /> <attribute alias="_CRMAutoGen_aggregate_column_Num_0" name="billedserviceunits" aggregate="sum" /> <link-entity name="account" from="accountid" to="customerid" alias="ab"> <attribute name="new_serviceunitssla" alias="aggregate_column2" aggregate="max" /> </link-entity> </entity> </fetch> - Now that a new field has been included in the
FetchXML, we can add it to the<measurecollection>, so that it is included in the calculations:<category alias="_CRMAutoGen_groupby_column_Num_0"> FetchXMLusing, for data combination in chart<measurecollection> <measure alias="_CRMAutoGen_aggregate_column_Num_0" /> </measurecollection> <measurecollection> <measure alias="aggregate_column2" /> </measurecollection> </category> - Next, we set up a new Line chart in red to display the Account's Service Unit Agreement value against the Case's Billed Service Units results shown in the existing column chart:
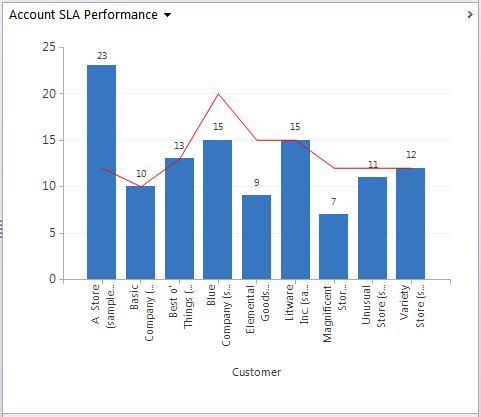
<Series> <Series ChartType="Column" IsValueShownAsLabel="True" Font="{0}, 9.5px" LabelForeColor="59, 59, 59" CustomProperties="PointWidth=0.75, MaxPixelPointWidth=40" /> <Series ChartType="Line" CustomProperties="PointWidth=0.75, MaxPixelPointWidth=40" LabelForeColor="59, 59, 59" Font="{0}, 9.5px" BackGradientStyle="None" Color="255,0,0" IsValueShownAsLabel="False"/> </Series> - Now that all of those changes have been made to the Chart XML, import the chart and you will see the final results, as shown in the following screenshot. Note that the results may vary depending on the amount of data you have in your system:
This recipe covered some of the basics around using FetchXML to specify what data is being combined in a chart. The following URL to the Microsoft MSDN library provides more detailed information along with examples on how to use FetchXML:
http://msdn.microsoft.com/en-us/library/gg328332.aspx
Learning all the syntax conditions around FetchXML can be fun for some people. There is a much easier way to build FetchXML queries in Dynamics CRM 2011 using the Advance Find query tool.
Launch the Advanced Find dialog in Dynamics CRM and build a query that pulls the data that you wish to see in your chart. This can also include data from multiple entities, similar to what we did earlier in this recipe. Once you have tested the query and found the results that you are looking for and edit the column layout to include the fields you need, click on the Download Fetch XML button in the Advanced Find ribbon toolbar, as shown in the following screenshot:
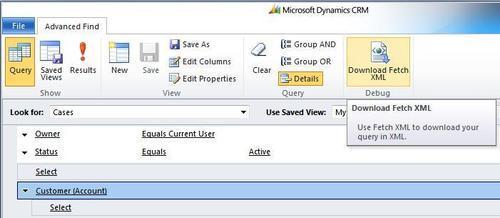
Clicking on that button will download a FetchXML file that you can then use to replace or augment the FetchXML query being used by your CRM chart:
<fetch version="1.0" output-format="xml-platform" mapping="logical" distinct="false">
<entity name="incident">
<attribute name="incidentid" />
<attribute name="billedserviceunits" />
<attribute name="customerid" />
<order attribute="billedserviceunits" descending="false" />
<filter type="and">
<condition attribute="ownerid" operator="eq-userid" />
<condition attribute="statecode" operator="eq" value="0" />
</filter>
<link-entity name="account" from="accountid" to="customerid" alias="aa">
<attribute name="new_serviceunitssla" />
</link-entity>
</entity>
</fetch>