
Viewing Dynamics CRM data in charts is an excellent way to analyse data; however, sometimes you might also want to filter the raw data and have it dynamically adjust the accompanying chart. In Dynamics CRM 2011, just about every view (list) has the ability to show a related chart. This gives users the ability to start with a basic chart and list, and then filter or adjust records and see how the charts are affected.
Carry out the following steps in order to complete this recipe:
- Select the Microsoft Dynamics CRM Overview dashboard from the list of available dashboards.
- Locate the Sales Pipeline chart on this dashboard. Move your mouse cursor to the upper right-hand corner of the chart and you will see a small menu appear as shown in the following screenshot:
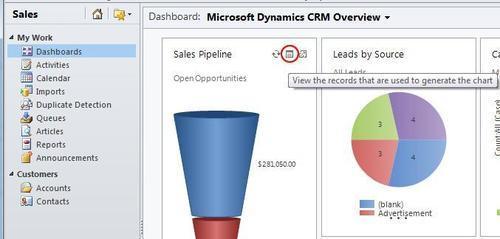
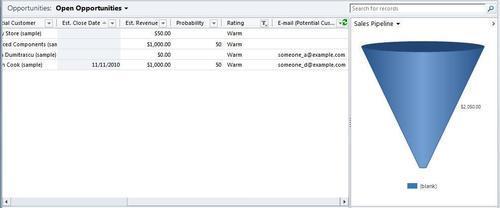
- Click on the second menu item; the tooltip will read View the records that are used to generate the chart. This will launch a new browser window that contains a listing of records used to render the Sales Pipeline chart that happens to be shown on the Microsoft Dynamics CRM Overview dashboard, as shown in the following screenshot:
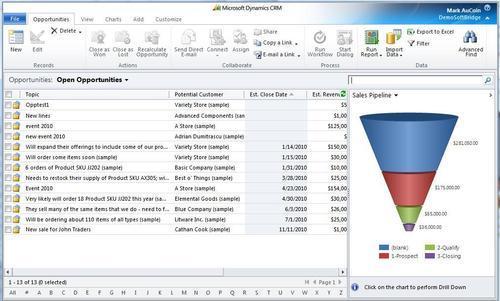
- We want to filter this data based on the different opportunity rating values. Using the view's horizontal scrollbar, scroll all the way to the right until you see the Rating column heading.
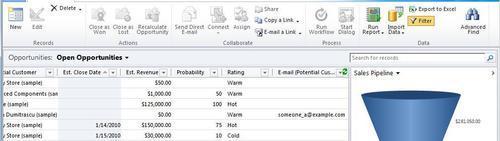
- Now, find the Filter command button located on the Windows Ribbon toolbar and click on it. The column headings will now have small arrows on the right side of the text indicating that a drop-down menu is now available for each column, as shown in the following screenshot:
- Click on the small drop-down arrow located in the Rating column's heading, as shown in the following screenshot. This will show a context menu that allows you to filter the data you see by one of this column's pick-list values:
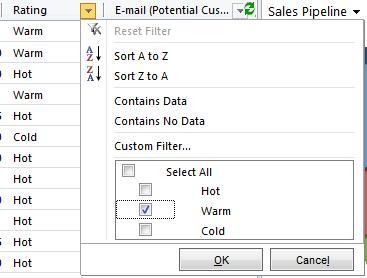
- Check the option for the Warm data value and then click on the OK button to apply the filter rules. You may need to manually refresh the chart control; a Refresh Chart button will appear if you need to:
The filter option is common across most data views in Dynamics CRM 2011. It allows you to perform quick queries and apply multiple filters to the data at the same time. The chart works from the data being shown in the list.
We will now take a look at how we can filter data using a chart drilldown.
The chart being shown with these lists of data still supports the drill-down option (covered in the Drilling down into a chart recipe). When you perform a drilldown on the chart in this example, you are in effect applying a filter to the data. The data in the list located on the left side of the screen will reflect the request made when drilling into the chart.