Charts are a very big part of the new dashboard features in Microsoft Dynamics CRM 2011, and one of the best features of the new chart module is the ability to drill into segments of the chart data. By drilldown, we mean the ability to filter the data and focus on a particular segment of the records being used to build the chart as a whole.
Carry out the following steps in order to complete this recipe:
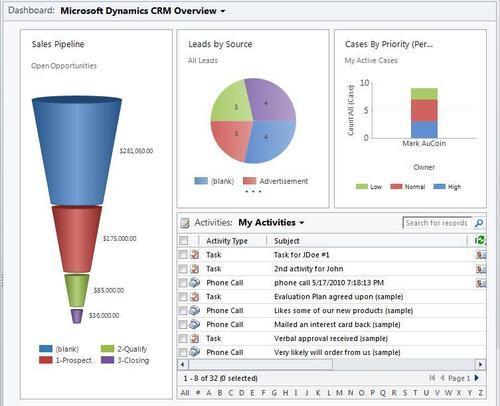
- Select the Microsoft Dynamics CRM Overview dashboard from the list of available dashboards.
- Locate the Sales Pipeline chart, and enlarge the chart to make it easier to work with (see the Enlarging a chart to full screen recipe at the beginning of this chapter):
- Click on one of the segments in the funnel chart. I would suggest the segment shown in red named 1-Prospect as we know it has some good sample data. You will see a small pop-up menu appear, as shown in the following screenshot:
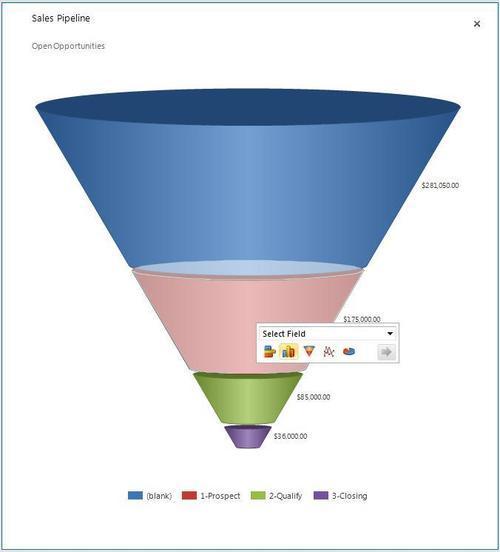
- This menu allows you to specify how you want to drill into the segment data for this chart. Click on the Select Field pick list to see the field options, and select the field named Potential Customer.
- Next, select the chart type that you would like to use for this new chart. Leave the default bar chart selected for now.
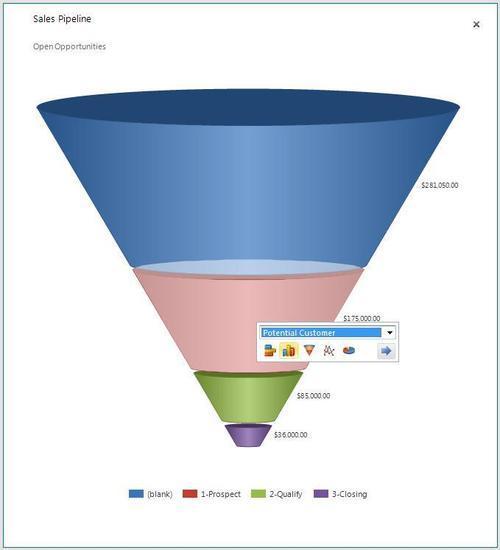
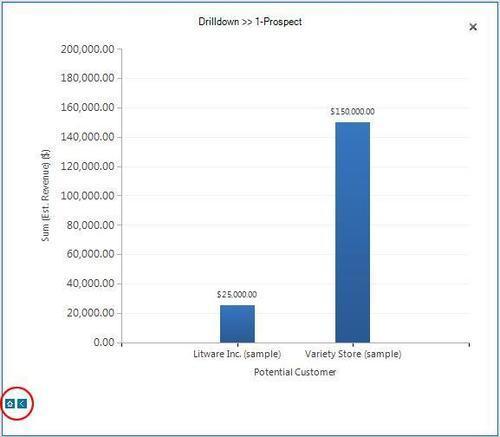
- On the pop-up menu, click on the blue right-pointing arrow to generate the report. The resulting chart will show the open opportunities that have a pipeline phase equal to 1-Prospect, and group that data by the Potential Customer field, as shown in the following screenshot:
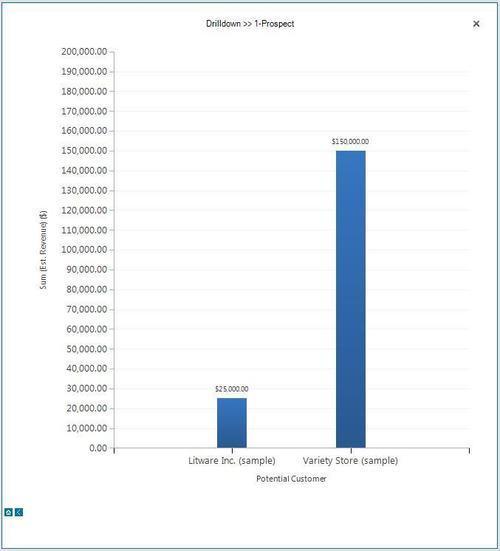
Let's take a look at how you can get back to the original chart.
Once you start to drill down into the chart data, you may want to take steps back to view the original chart. There are a small blue chevron and a home icon located at the bottom left-hand corner of the new drill-down chart. Click on the chevron to move up a level in the chart data, or click on the home icon to move back to the original chart. Clicking on the x (shown in the following screenshot) icon will close the expanded chart and take you back to the dashboard view: