The previous recipe, Installing the free Dashboard Reports control, showed the reader how to install and test the CRM Dashboard Reporting control. This recipe will create a new User dashboard and add the reporting control while learning about the various features.
In order to complete this recipe, the user must have installed the Dashboard Reporting Control for Microsoft Dynamics CRM 2011 solution package as outlined in the previous recipe.
Carry out the following steps in order to complete this recipe:
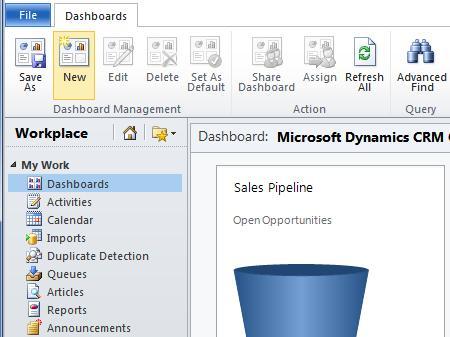
- Select the Dashboards link from the Workplace area and click on the New button to create a new User dashboard:
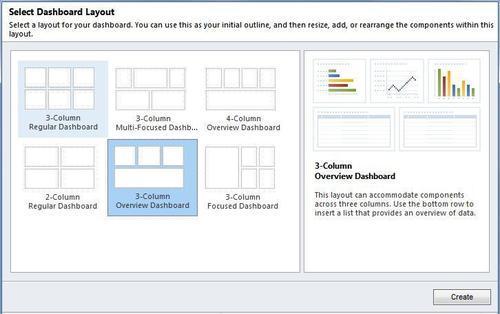
- The Select Dashboard Layout dialog will appear; select the 3-Column Overview Dashboard layout and click on the Create button, as shown in the following screenshot:
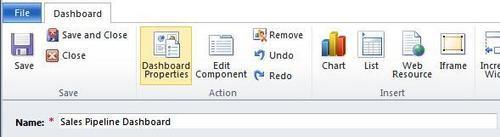
- For the Name of the new dashboard, enter Sales Pipeline Dashboard and then click on the Save button:
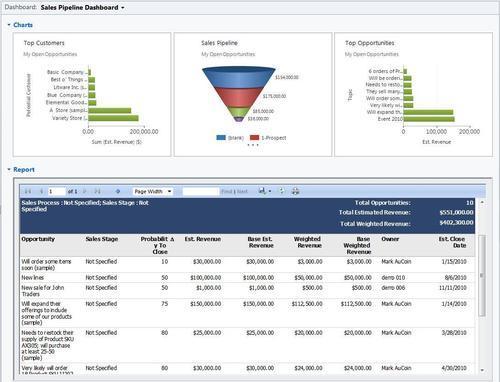
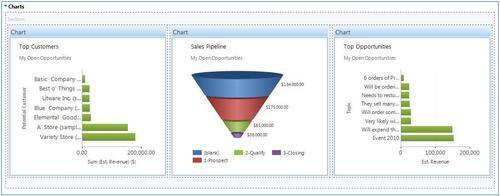
- Customize the first tab of the dashboard by changing the label from Tab to Charts. Then, add three charts that show data related to the Sales module. Add the following charts for the Opportunity entity and base them on the My Open Opportunities view. The charts are: Top Customers, Sales Pipeline, and Top Opportunities. The dashboard should look like the following screenshot:
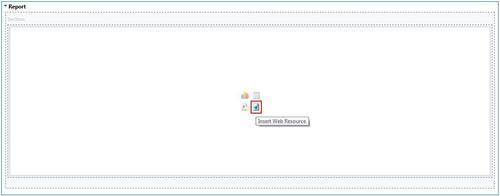
- Move onto the second tab and change the label from Tab to Report. Add a web resource by clicking on the icon with the tool tip Insert Web Resource located in the component placeholder, as shown in the following screenshot:
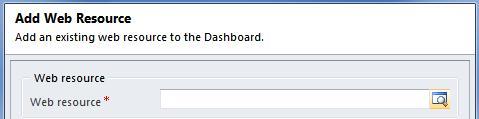
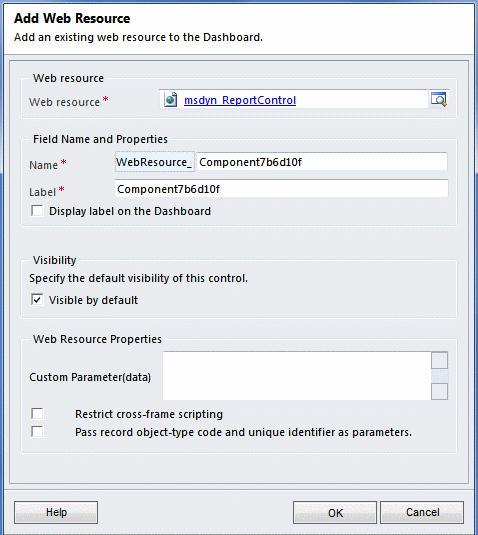
- The Add Web Resource dialog will appear; click on the lookup button to search for available web resource components:
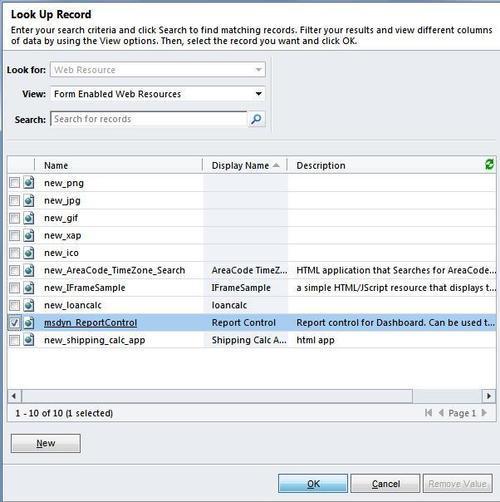
- Locate the web resource named msdyn_ReportControl, select it, and click on the OK button to continue:
- Back on the Add Web Resource dialog, make sure that the Restrict cross-frame scripting and Pass record object-type code and unique identifier as parameters options are not checked. Leave the Custom Parameter(data) textbox empty for now and click on the OK button. On the main Dashboard Editor screen, click on the Save button to commit all recent changes:
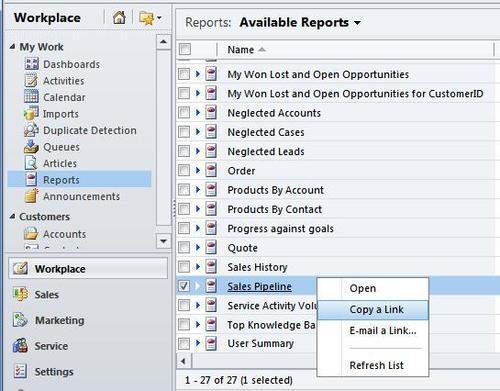
- Now, we need to gather information about the report to display in the dashboard. Navigate to the Reports module in the Workplace area; locate and select the report named Sales Pipeline in the Available Reports view. Right-click on the record to show the Options menu, and click the Copy a Link menu item:
- This next step will parse the copied link to get the unique report
idneeded for the dashboard component. Open up a simple text editor such as notepad and paste the string value that was copied from Dynamics CRM. The link should look something like the following (theidvalue will probably be different):https://demosoftbridge.crm.dynamics.com/crmreports/viewer/viewer.aspx?id=%7b51B73213-68F5-DE11-AB95-02BF0A0679D8%7d - From this long string value, copy the
idvalue to your clipboard. Theidvalue is located between the%7band%7dcharacter patterns. Based on the link in our example, we would only copy the following value to our clipboard:51B73213-68F5-DE11-AB95-02BF0A0679D8
- Navigate back to the new dashboard and edit the Report Control component. Paste the report
idvalue into the Custom Parameter(data) field and click on the OK button, shown in the following screenshot: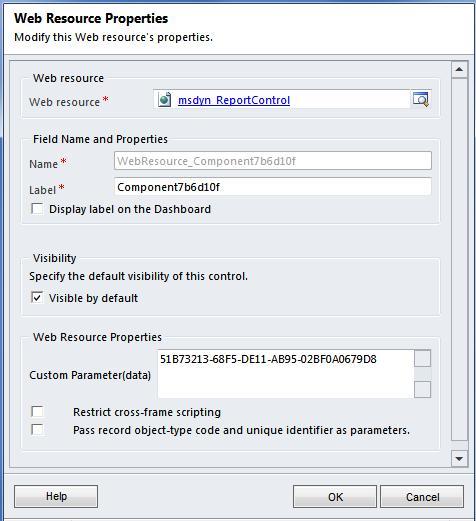
- On the Dashboard Editor screen, click on the Save and Close button. Navigate to the Dashboards area in Dynamics CRM, locate the new Sales Pipeline dashboard and select it so that the results are displayed on the screen.
- The report being displayed is fully interactive; you can adjust the report's filter settings and drill down into the charts, as shown in the following screenshot:
Note
Similar to using a standard IFrame, depending on the size of the report being shown, horizontal and vertical scroll bars will appear to help you navigate and view the report contents.