In the previous recipe, we added a new chart to a personal dashboard. This recipe will cover editing the different settings that are available for displaying a chart on a dashboard.
Carry out the following steps in order to complete this recipe:
- Select the Dashboards link from the Workplace area.
- Select the same personal dashboard that we created earlier in this chapter in the first recipe (Creating a user dashboard).
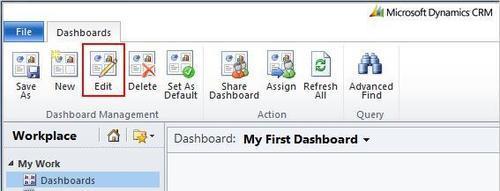
- From the Dashboards menu in the Dynamics CRM 2011 ribbon, click on the Edit button, as highlighted in the following screenshot:
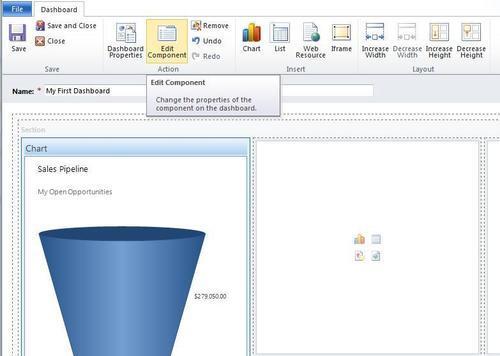
- The dashboard editor screen will open, and your dashboard will be in edit mode. Select the Sales Pipeline chart and click on the Edit Component button in the ribbon toolbar, as shown in the following screenshot:
- The List or Chart Properties dialog will appear. This dialog is different from the Component Designer window that you saw when we added a chart to this dashboard earlier in the Adding a chart to your dashboard recipe. The following screenshot and sections will explain the different settings in detail:
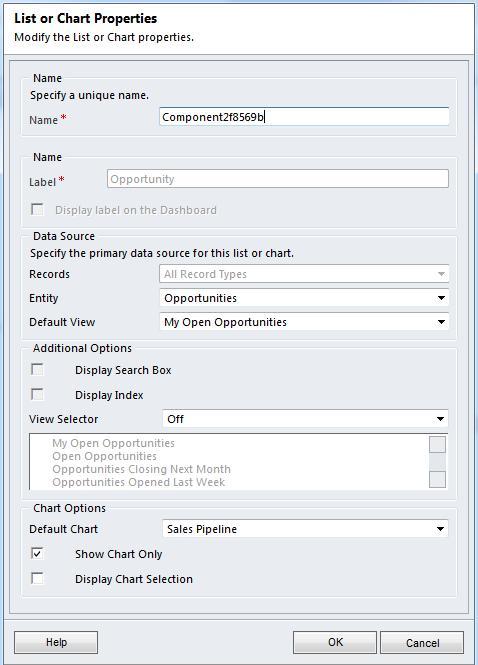
When editing a chart control in the dashboard editor, there are many options that can be configured by the user. This section will review each of those options.
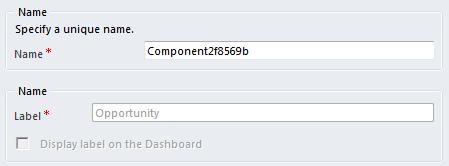
The Name field contains a unique ID that is used to identify each chart component within the dashboard. This value is internal, and will not be shown when the chart is displayed.
The Label field can be used to display a title for the chart when used on a dashboard. In order to show the label, provide a descriptive value and select the Display label on the Dashboard checkbox. The Label property can only be modified when the chart or list components—that is the View Selector option—is not set to Off. Otherwise, the label value is set to the name of the view that is providing the data records:
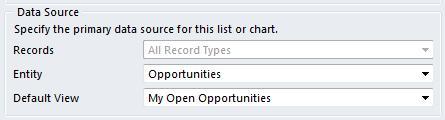
The data that is gathered and used to generate the chart is based on the settings identified in the Data Source section of the List or Chart Properties window. Two of the following three fields in this section can be configured:
- Records: This field will be set to All Record Types. The value does not need to be changed when working with chart components.
- Entity: This field lets you change the entity type for this chart component. Changing this value affects the list of available views in the Default View field. In our example, the Entity field is set to Opportunities, which means the chart will show Opportunity data in the visualization.
- Default View: This field lists the available data views for the entity type that was selected in the Entity field. The selected view will provide the data needed to generate the chart visualization.
These options are depicted in the following screenshot:
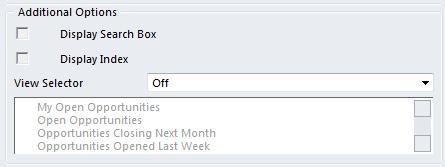
The Additional Options section has a few settings that are only applicable when viewing a list and chart combination (the left-hand side of the component would show a list of data, while the right-hand side would show the chart visualization). In this example, we are only dealing with a single chart component, therefore, the Display Search Box and Display Index settings are not applicable and will be disabled.
The View Selector determines if the dashboard user can change the view being used to provide data for the selected chart. For example, a user could start with the chart using a view of all active records, and then switch the chart view to look at inactive records for comparison:
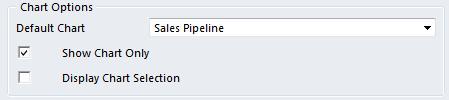
The Chart Options section identifies the default chart being shown for the component. The Default Chart field provides a list of the available charts that you can set as the default chart. The list of available charts is dependent on the value of the Entity field located in the Data Source section of this window.
The Show Chart Only option lets you decide if the user sees only a chart component or a mix of a chart and associated data view.
The Display Chart Selection option allows the dashboard user to change the Default Chart at runtime. If the user changes the chart at runtime, those changes will not be saved with the dashboard. Every time the dashboard is visited, the original Default Chart is shown: