
This recipe will introduce you to some of the undocumented features available to the chart component in Dynamics CRM. When building a chart, Dynamics CRM will provide labels for the axis, but they are not the most user-friendly. This recipe will show you how to override those standard labels with something more meaningful along with setting formats for the Series data labels.
This recipe assumes that you are working with the chart created earlier in the Exporting a chart recipe. This chapter also assumes that the reader has access to an XML editor such as Microsoft Visual Studio.
Carry out the following steps in order to complete this recipe:
- Locate the exported Chart XML file (either System chart or user chart) that was created in the earlier recipe. Open the XML file in the editor of your choice.
- In order to change the axis labels, locate the
<AxisY>element inside the<ChartArea>element. Add a new property to the element as follows:
|
Property |
Value |
|---|---|
|
|
|
- The following code demonstrates this:
<AxisY Title="Total number of Cases" LabelAutoFitMinFontSize="8" TitleForeColor="59, 59, 59" TitleFont="{0}, 10.5px" LineColor="165, 172, 181" IntervalAutoMode="VariableCount"> - Locate the
<AxisX>element as well, and add a new property to it as well.
|
Property |
Value |
|---|---|
|
|
|
- The following code demonstrates this:
<AxisX Title="Grouped by Priority" LabelAutoFitMinFontSize="8" TitleForeColor="59, 59, 59" TitleFont="{0}, 10.5px" LineColor="165, 172, 181" IntervalAutoMode="VariableCount"> - Locate the
<Series>element and add a new property to set the format.
|
Property |
Value |
|---|---|
|
|
|
- The following code demonstrates this:
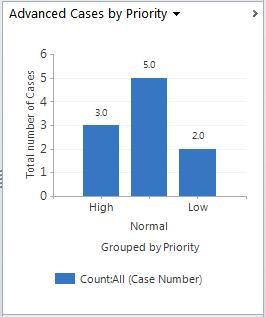
<Series LabelFormat="F1" ChartType="Column" IsValueShownAsLabel="True" Font="{0}, 9.5px" LabelForeColor="59, 59, 59" CustomProperties="PointWidth=0.75, MaxPixelPointWidth=40"></Series> - Save the changes made to the
.xmlfile and import the chart back into Dynamics CRM (refer to the Importing a chart recipe for more details) to see the results. You will notice the Axis labels are different and theLabelFormathas changed from a single integer to a Fixed-Point format with one decimal place. This is shown in the following screenshot:
The presentation description section of the Chart XML controls the appearance of the chart. There is no XML schema available to validate this section, but the Chart XML is a serialization of the Microsoft Chart Control from the Microsoft .NET 3.5 framework. Although not all of the properties are implemented, you can refer to the Microsoft Chart Control's .chm help file for more detailed information on the properties available. The following link will provide you with a download of the MS Chart control and the associated documentation:
Understanding all of the different parameters and options available for extending charts in Dynamics CRM can take a long time. This section gives a quick overview of the Chart XML Schema along with some of the property settings for the data label formats.
The Chart XML shown in the .xml file exported from Dynamics CRM is editable, and can be modified to create results that cannot be modeled using the built-in chart designer in Dynamics CRM. The Chart XML Schema is made up of 2 main portions, each with its own important sub-sections. The other recipes in this chapter will each modify parts of the Chart XML to change the chart presentation. The Microsoft Dynamics CRM SDK provides detailed information around the Chart XML schema and all of the elements and attributes. The following is an overview of Chart XML:
<visualization>
<datadescription>
Chart XML Schemaoverview{...fetch xml...}
{...charting columns...}
</datadescription>
<presentationdescription>
{...chart series...}
{...chart areas...}
{...titles legends...}
</presentationdescription>
</visualization>
Neither the MS Chart Control nor the Dynamics CRM 2011 documentation covers all of the formatting options available for the LabelFormat property. However, the Microsoft MSDN documentation does have a section on the overall .NET Framework formatting strings, which can be applied to the Chart control in Dynamics CRM 2011.
The following are some samples of common format strings that will work with the LabelFormat property for Dynamics CRM 2011 chart controls:
|
Format String |
Name |
Description |
Example using "123.45" |
|---|---|---|---|
|
|
Currency |
A numeric value is converted to a string that represents a currency amount. |
$123.45 |
|
|
Decimal |
Works only with integer values. |
123 |
|
|
Fixed-Point |
Converts the number into decimal format. Adding a precision value to the format will specify the number of decimal places. |
123.45 "F1" equals 123.6 |
|
|
Percent |
The number is converted into a string that represents a percent value. The precision value indicates the number of decimal places. |
12,345 % |
|
Format String |
Name |
Description |
Example using "11/18/2011 2:30:44 PM" |
|---|---|---|---|
|
|
Short Date |
Shows a Short Date pattern that follows "MM/dd/yyyy". |
11/18/2011 |
|
|
Long Date |
Shows a Long Date pattern that follows "dddd, MMMM dd yyyy". |
Friday, November 18, 2011 |
|
|
Short Time |
Shows a Short Time pattern that follows "HH:mm". |
2:30 PM |
|
|
Long Time |
Shows a Long Time pattern that follows "HH:mm:ss". |
2:30:44 PM |
|
|
Month |
Shows a Month Day pattern that follows "MMMM dd". |
November 18 |
|
|
Year |
Shows a Year pattern that follows "yyyy". |
2011 |
These are some links to the online MSDN documentation that explain the following available formats in more detail:
- Standard Numeric Format Strings:
http://msdn.microsoft.com/en-us/library/dwhawy9k(v=VS.85).aspx
- Custom Numeric Format Strings:
http://msdn.microsoft.com/en-us/library/0c899ak8(v=VS.85).aspx
- Standard DateTime Format Strings:
http://msdn.microsoft.com/en-us/library/az4se3k1(v=VS.85).aspx