When working with charts and reporting options, there is often a need to compare more than one series of data from the same record. A simple example of this is when comparing actual revenue versus estimated revenue for closed opportunities. In order to meet this need, Dynamics CRM supports using multiple series in charts.
This recipe assumes that the reader understands the basics of creating a chart. The techniques described here follow the creation of a System chart, but are the same when creating a user chart.
Carry out the following steps in order to complete this recipe:
- Start by creating a new System chart based on the CRM Opportunity entity. For information on how to create a chart, refer to the Creating a system chart recipe or Creating a user chart recipe.
- In the Chart Designer dialog, click on the Column icon in the Charts area of the toolbar and select the standard Column type.
- For the chart name, use Actual Revenue vs. Estimate Revenue by Probability.
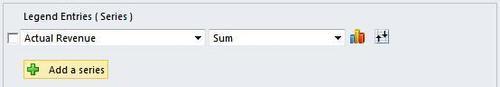
- In the Legend Entries (Series) section, select the Actual Revenue field. Change the aggregate method to Sum.
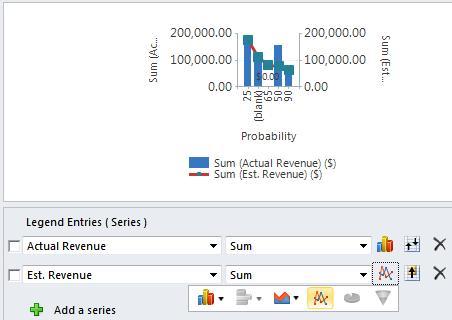
- Click on the Add a series link to create a new Legend Entries (Series) entry, as shown in the following screenshot:
- Select the Est. Revenue field for the new entry.
- Next, select the Probability field for the Horizontal (Category) Axis Labels option. The chart will render in preview mode showing you what the finished product will look like:
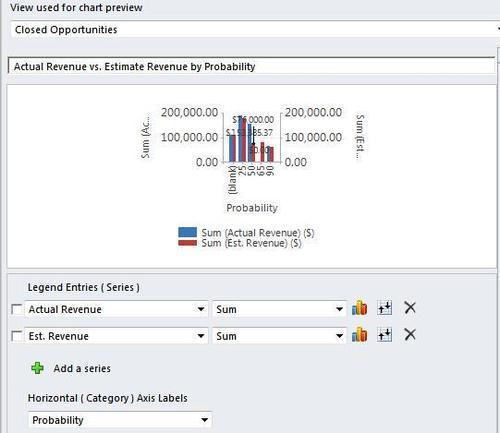
- Click the Save & Close toolbar button to save the new multi-series chart.
The chart prepared in this recipe used a two-series comparison. The following sections will describe some of the other options available for this type of chart.
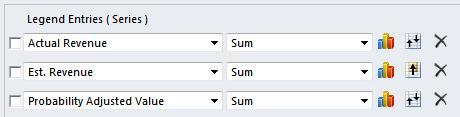
The example in this recipe used a two-series comparison, but the Chart Designer can support up to five series. In order to add more series, simply click on the Add a series link again and then specify the field to chart on. In my example, I have a custom Probability Adjusted Value field that I used for the third series, as shown in the following screenshot:
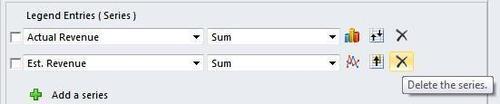
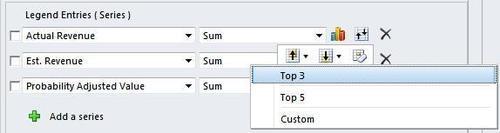
Along with adding more series to the chart, you can also set the Top/Bottom option for each individual series. In order to set the Top/Bottom option for a series, click on the Top/Bottom icon located next to the series aggregate function. This will expand into the same menu options available from the main toolbar without having to first select the series using the selection checkbox:
Sometimes viewing the comparison data is easier when each series is represented in a different chart type. An example of this might be comparing actual revenue against estimated revenue by using a bar chart and line chart to see the differences. In order to change the chart type for a series, click on the chart icon located next to the aggregate drop-down. This will display a small menu that allows you to specify the display type to be used for each series in the chart, as shown in the following screenshot: