
3
Doing Survey Research in Media Studies
ABSTRACT
Survey research is a widely used methodology for collecting quantitative data and is particularly useful for conducting research in communication and media studies. This essay provides an overview of survey methodology, its historical background, and its uses in communication and media studies. It explains some of the basic concepts in survey design such as sample, sampling procedures, questionnaire design, and modes of distribution of questionnaires. It also provides a guideline for conducting survey research and discusses some of the unique challenges faced by survey researchers both within a single country and internationally when conducting cross-cultural survey research. The chapter concludes with a discussion of ethical issues in survey research.
Information is a valuable commodity that is of great importance to governments, businesses, and institutions. Thus information is constantly being gathered using various techniques, tools, and methods all over the world. Anybody who uses the Internet today has seen or filled out a survey asking for their opinions on topics ranging from the trivial (celebrity dress and cat videos) to more serious social, political, and economic issues. Most people today have also seen the use of survey techniques to measure television viewing or public opinion on political candidates and issues, or in market research to understand public attitudes toward products, brands, or advertising campaigns. However, most of the surveys we encounter in our everyday lives are not conducted in a scientific manner, and thus their results are skewed, biased, and not generalizable to the population that is being studied.
A scientific survey methodology is a quantitative research method that uses a well-designed questionnaire to collect data from a representative sample in order to generalize to a population. Media researchers who want to use survey methodology for their study must carefully examine the issues surrounding survey questions and instrument design, sampling, data collection, and analysis in order to reduce error and to increase the precision of their findings. In addition, media researchers who want to conduct global or cross-cultural research to compare data across countries must take into account differences in language and culture that affect survey design and responses.
This chapter covers the history of survey methodology, focusing on its use in media and media studies, discusses when to use survey methodology, provides procedures for conducting a survey, discusses some of the unique challenges in conducting survey research in general and in conducting cross-cultural survey research in particular, and concludes with a discussion of the ethical issues in survey research.
History and Uses of Survey Methodology in Media Studies
Historically, the need for surveys in the United States began with article 1, section 2 of the US Constitution (Converse 2009; Groves 2011), which says:
Representation and direct Taxes shall be apportioned among the several States which may be included within this Union, according to their respective Numbers . . . The actual Enumeration shall be made within three Years after the first Meeting of the Congress of the United States, and within every subsequent Term of ten Years, in such Manner as they shall by Law direct.
This requirement of a decennial census was meant to aid proportional representation in the House of Representatives as well as in the appropriation of taxes. A census, which involves gathering information from every individual in the population, has been a great source of information for making decisions in the governmental realm. Today, however, individuals and institutions use census data for purposes such as the distribution of federal funds; planning for hospitals, schools, transportation, and other services; the understanding of labor supply, migration, and urbanization; the delivery of goods and services; the planning of political campaigns; the setting up of businesses and retail outlets; and the delivery of catalogs and direct mail. A census, although it may be desirable to study populations, is difficult to administer and requires massive resources to conduct. Most people cannot undertake a census; thus they study smaller groups or samples to fulfill the research need.
Media's use of surveys began in the nineteenth century when newspapers wanted to find out the voting preference of their local audience (Martin, 1984). The early polls were mostly local, less scientific by today's standards, and dealt with voters' choice in an election rather than with public opinion on issues. Newspapers such as the Harrisburg Pennsylvanian and the Raleigh Star conducted public polls before the presidential elections, and other newspapers and magazines such as the Boston Globe, Farm Journal, and the Literary Digest followed suit (Martin, 1984). Data were often gathered using questionnaires that were published in newspapers and magazines for readers to fill out and mail in, or interviewers were sent to people's homes. These kinds of surveys and polls reflected the views of the subscribers of those magazines and newspapers, not quite those of the general public. Nevertheless, journalists found the polls useful as they added credibility and weight to their news stories (Groves, 2011).
The modern survey methodology that uses a small subset of the population, the sample, to represent the population was developed in the twentieth century. Groves (2011) describes three distinct eras of development of modern survey research. In the first era (1930–1960), the basic components of survey design and statistical analysis was invented. The second era (1960–1990) saw the wide implementation of survey methodology in areas such as social science, political science, consumer research, and market research. Researchers from different fields often used survey methodology to gather information for the US federal government and to make business decisions. In the third era (1990 to the present), Internet technologies began to be used to gather data quickly and easily. Even though mobile and web technologies make it easy to conduct surveys, researchers are finding that people's participation in survey research is declining, which poses challenges for survey researchers (Groves, 2011).
Empirical survey research in media studies began in the early part of the twentieth century. The credit for growth and development of modern surveys is given to several individuals. Among them are Paul Lazarsfeld and George Gallup. Walter Lippman's seminal work Public Opinion (1922) laid the groundwork for media studies and media research. His writings focused on media's influence on public perception and public policy. Thus began a series of research to understand media's influence on the public. One of the prominent social scientists who studied mass communications using survey methodology was Paul Lazarsfeld. Lazarsfeld established the Office of Radio Research at Princeton University to study the importance of radio, the new medium of the time, in the lives of listeners. His work focused on understanding the voting behavior of the public and the persuasive appeal of mass media. Lazarsfeld's works, The People's Choice (Lazarsfeld, Berelson, & Gaudet, 1948) and Personal Influence (Katz & Lazarsfeld, 1955) broke new ground in mass communication research in the 1940s and 1950s. The two-step flow theory, the role of the opinion leaders in mediating the influence of media, and media's role in creating a passive audience – described as “narcotizing dysfunction” – are just a few of his paradigm shifting contributions to media research. Lazarsfeld not only contributed to the development of media theories; he also developed panel studies and contextual analysis and perfected the survey methodology. He trained many researchers at his Bureau of Applied Social Research in Columbia University and inspired the establishment of many institutional research centers within the United States and abroad (Merton, 1979). Institutional research centers such as the NORC at the University of Chicago and the Survey Research Center at the University of Michigan today conduct local and national surveys on a regular basis. Converse (2009) notes that there are more than 2,000 nonprofit research centers and many more for-profit research firms.
The other person who helped develop survey methodology was George Gallup. Gallup rose to national prominence in 1936 when he correctly predicted Franklin Roosevelt's win over Alfred Landon for the US presidency, contradicting the predictions made by Literary Digest, the leading poll of that time. This event gave credibility to scientific polling methods, which did not just rely on large numbers of respondents but used a representative sample (Gallup, n.d.; Gallup & Rae, 1940). Gallup applied survey research methodology in many areas of media research, including newspaper readership, radio listenership, print and television ad effectiveness. He also tested the appeal of Hollywood story ideas among the public (Gallup, n.d.).
Over a period of time, surveys became one of the most popular research methodologies. These were used in political polling; media audience studies; estimating audience size for newspapers, magazines, television, and so on; testing advertising effectiveness, brand awareness, market share; and other forms of consumer research. Survey research methodology is also popular among media scholars in academia who often study the social effects of media. For example, George Gerbner's famous studies on the effects of television violence on the public included survey methodology (Gerbner & Gross, 1976; Gerbner, Gross, Morgan, & Signorielli, 1980).
When to Select Survey Methodology
There are many research methodologies available to media researchers. Each method has its strengths and weaknesses. Survey methodology is best suited for studies where the goal is to produce quantifiable and generalizable results, particularly results that can help in decision making and policy implementation. There are, of course, times when the researcher is not concerned with numerical precision and just wants to get a feel for an issue, idea, or opinion. In these cases too survey methodology can be helpful. Survey methodology can be used for exploration, description, and explanation (Adams, 1989). It can help to demonstrate correlational links between the variables. However, researchers should not rely on survey methodology to prove causation. Causation can be best demonstrated using experimental research methodology.
Procedure for Conducting a Survey
Survey methodology starts with the research question the researcher wants to answer. It then involves making decisions on study design, the mode of administering the survey, whom to survey, what kind of questions to ask, and how to ask them. While these are important for all studies involving survey methodology, cross-cultural survey studies have an additional layer of complexity. Cross-cultural researchers have to think about issues of equivalency for their data to be comparable across the countries or cultures being studied. Thus they have to strive for sample equivalence, linguistic and conceptual equivalence, and metric or instrument equivalence (Choudhry, 1986; De Mooij, 2010; Douglas & Craig, 1983; Mueller, 2006). These will all be discussed later in the chapter.
Selecting a Study Design
There are two main types of survey study designs, cross-sectional and longitudinal. The purpose of the study determines the study design. Cross-sectional studies are done once to fulfill the information need. Longitudinal studies collect data from a sample over a period of time. Longitudinal studies often measure the same sets of variables over a time period and help in noting changes in attitudes, opinions, or behaviors. Even though longitudinal studies tell us the trend or changes that are taking place, they do not tell us why the changes are occurring. Changes in a population occur for various reasons. They can be due to the natural growth of individuals as they move through the life cycle or to a circumstance or major event in their life. Cross-sectional studies are more common among media researchers than longitudinal studies because they serve the need for current data and provide a snapshot of a population at a given time. They are also quicker, cheaper, and require fewer resources to carry out. Longitudinal studies are time-consuming and costly to conduct.
There are three basic kinds of longitudinal studies: trend, cohort, and panel studies. Trend studies involve studying a population at different times. Smith (1980) did a trend survey from 1946 to 1976 called “America's most important problem” to understand changes in long-term and short-term public concern. Cohort studies involve collecting data over a period of time from the same subgroup of the population (called a cohort). Cohorts are basically people who are linked together in some way, for example a high school graduating class of 2013. Here the researchers don't have to collect data from the same individuals over a period of time. Instead they can collect data from anyone in the cohort. Rentz, Reynolds, and Stout (1983) studied a cohort to understand how aging affects the consumption of soft drinks. The Centre for Longitudinal Studies in the United Kingdom often conducts cohort studies. One of their studies is the Millennium Cohort Study (MCS), which involves 19,000 children born in the United Kingdom in 2000–2001, to understand the diverse issues affecting this generation (Centre for Longitudinal Studies, n.d.). Panel studies differ from cohort and trend studies in that they involve gathering information over a period of time from the same sample of respondents (called a panel). In cohort and trend studies, different individuals may be surveyed but in panel studies the same individuals are often studied. The University of Michigan has been conducting a panel study since 1968, the longest panel study in the world, called the Panel Study of Income Dynamics (PSID). It involves a study of 18,000 individuals living in 5,000 families. There are shorter panel studies too. Aubrey (2006) conducted a two-year study exploring the effects of sexually objectifying media on self-objectification among a panel of undergraduate students.
Assessing the Mode of Delivering the Questionnaire
Researchers have to think in advance about how to deliver the questionnaire to the respondents. Survey researchers commonly administer surveys in person, also called in-depth interviews (IDIs) or face-to face interviews, by mail, by phone, or over the Internet using emails or websites. The choice of the mode through which to administer surveys depends on several factors such as speed, cost, comfort level of the respondents with the mode, literacy level, sensitive nature of the questions, and whether the researcher wants to incorporate audio, video, or any other graphics in the survey.
Email and web surveys are much faster to administer than mail surveys. Surveys conducted in person are much more expensive than mail, Internet, or phone surveys. If the population from which the researcher wants to collect data is not comfortable using the Internet or does not have access to a computer, this is not a viable option for delivery. Similarly, mail and Internet surveys are not the best options for collecting data from people who are illiterate or less educated. In this case in-person interviews might be necessary. If the research involves asking sensitive questions such as those related to sex or diseases, face-to-face collection of data can make the respondent uncomfortable. In this case mail or Internet surveys might be the best option. Media studies often involve noting reactions to images, audios, and videos. This can limit the options that the researcher has. One can play or show the images on a computer during a face-to face session to note the reaction or administer it over the Internet. Web technologies have made it much easier to incorporate videos and graphics in a survey, which can be sent to the respondents to watch, after which they can answer the related questions. However, if the graphics or videos are of a sensitive or sexual nature, the researcher needs to think in advance where the respondents are likely to access the survey: at home or in a public area. College students often use college facilities such as libraries or computers in a public area to do their work and might feel embarrassed watching sexual content in a public area. In this case, before the video is played, it is important to warn the audience about the nature of the content. More pros and cons of using a particular option to administer a survey are listed in Table 3.1.
Table 3.1 Advantages and disadvantages of different modes of administering a survey
| Face-to-face interviews | Telephone survey |
Advantages
Disadvantages
|
Advantages
Disadvantages
|
| Mail survey | Online/web survey |
Advantages
Disadvantages
|
Advantages
Disadvantages
|
Selecting a Sample
In research it is neither practical nor feasible to collect data from every individual in the population one wishes to study. Thus sampling techniques were developed to select a sample from the population that accurately represents the population. A population is an entire group of people a researcher wishes to study. A sample is obtained from a list of individuals in a population. Whenever a sample is chosen from the population and not the entire population, there is always a chance that the sample does not accurately represent the population. This is referred to as sampling error. Sampling error can be reduced by increasing the sample size and by employing a scientific sampling procedure.
To select a sample from the population involves making decisions about some key issues such as the sample frame, the use of probability or nonprobability sampling procedure, the actual sample size, and the response rate. In cross-cultural research, the researcher also has to establish sample equivalence, that is, a sample in one country should match the sample in another country. De Mooij (2010) notes that a student sample that is generally considered similar across nations might not be so similar. For example, students in the United States generally live on campus, in Europe they live independently, and in Asia they often live with their parents. In addition, students in nations with a large income disparity often represent the upper strata of the society. Thus student samples across the world might not be similar.
Sample Frame
A sample frame consists of individuals or units from the population from which a sample is selected. A researcher normally does not have direct access to the population, so he or she relies on the sample frame to select a sample. Some of the commonly used sampling frames are: a list of registered voters, employment files, a list of driver's license holders, a telephone directory, a list of students enrolled in a university, and a list of organizations. The quality of the sample frame affects the quality of the sample. A sample frame should be selected based on its comprehensiveness in representing the population, probability of selection, and efficiency with which one can make the selection (Fowler, 2009).
Sampling Procedure
Once the researcher has selected the sample frame, the researcher has to decide how to select individuals or individual units to make up the sample. The two main techniques for drawing individuals for a sample from a sample frame are probability and nonprobability sampling.
Probability Sampling
Probability sampling procedures are considered more scientific and statistically precise, as they allow the researcher to calculate sampling error – the difference between sample characteristics and the population characteristics. In probability sampling each individual or individual unit has an equal chance of being selected. Thus the assumption is that random selection will lead to bias free selection of the sample that better represents the population one is trying to study. Simple random sampling systematic sampling stratified random sampling, and cluster sampling are common approaches to probability sampling.
Simple random is the basic probability sampling technique that is often described as similar to drawing a sample out of a hat. For example, if a researcher's sampling frame includes a list of 1,000 individuals from which he or she has to draw a sample of 100 individuals, the names of all 1,000 individuals will be first placed in a container for drawing. Then 100 names will be picked at random from the container, which is the sample for the study.
Researchers are also known to use a table of random numbers to generate a simple random sample. For telephone surveys, a simple random sample is often obtained through the process of random digit dialing (RDD). There are various ways for obtaining a sample through random digit dialing. The Pew Research Center explains its RDD process for landlines (Pew Research, 2013): “This method uses random generation of the last two digits of telephone numbers selected on the basis of the area code, telephone exchange, and bank number. A bank is defined as 100 contiguous telephone numbers, for example 800-555-1200 to 800-555-1299.”
Systematic sampling is similar to simple random sample, but here the researcher first determines who will be included in the sample by calculating a fraction. For example, if the researcher wants a sample size of 100 from a list of 1,000 individuals, he or she first divides 100 by 1,000 to get 1/10. This fraction suggests that 1 out of every 10 individuals needs to be selected in order to get a sample of 100. This is also known as the sampling interval. To determine a starting point for selecting a sample from the 1,000 listed in the sampling frame, the researcher picks any random number that falls within the sampling interval, which in this example is any number between 1 and 10. This is done to insure the selection process is by chance and not based on any judgment or bias. Let's say that the random number chosen is 4. The number 4 then becomes the starting point for sample selection, and every 10th individual on the list after 4 is included in the sample, that is, those listed as number 14, 24, 34, and so on till one obtains a sample size of 100.
Stratified random sampling is best used when one needs to highlight certain subgroups within a population or to maintain a certain proportion of subgroups in a sample. It is used, for example, if the researcher is interested in studying differences in attitude toward obesity between various subgroups of the US population or an advertiser is trying to study various target groups for a product. In these cases it is useful to have representatives from subgroups such as African Americans, Hispanics, Native Americans, and White Americans in the sample. In order to insure a representative sample, it might be useful to first divide the population into subgroups, or stratum, and then randomly select the same proportion of individuals from each stratum that one finds in the population. This insures that the sample represents the racial makeup of the population.
Cluster sampling is best used when a complete list of the population is difficult to construct or when the population naturally lives in clusters, such as college students. Cluster sampling is frequently used for studying public health issues. In cluster sampling the population is usually divided by geographic locations, regions, districts, counties, or postal zip codes, commonly referred to as clusters, and clusters are randomly selected for the study rather than individual units.
Nonprobability Sampling
Sometimes the researcher might just want to conduct an exploratory study to get a feel for what people are thinking or how they react to products and packaging. In this case the researcher is not concerned with numerical precision or accurate representation. So he or she would use some form of convenience sampling procedure to select a sample. The advantage of using nonprobability sampling procedures is that it helps to get a sample quickly and cheaply, but the disadvantage is that the sample obtained through this procedure is often skewed in terms of demographics or psychographics. For example, media researchers in academia often use university students as a sample because they have easy access to them, and students are more willing to participate for the extra credits they gain. However, university students do not accurately represent the adult population even through most university students are adults. Similarly, when journalists use websites for their opinion polls and “person on the street” interviews to get a quick feel for an issue, the characteristics of the respondents who participate in the poll most likely do not represent the characteristics of the population. Even though the sample obtained using the nonprobability sampling procedure is not mathematically precise, it is still useful for media research. There are various forms of nonprobability sampling procedures: purposive, convenience, haphazard, volunteer, judgment, quota, and snowball sampling.
In purposive sampling researchers select respondents based on certain criterion or characteristics, such as purchase behavior, interests, and so on. People who meet the criterion are selected for the study, while others are eliminated. For example, a researcher wanting to know why women buy brand X shampoo might only include those women who have purchased brand X in the past, while other men and women are not selected.
In convenience or haphazard sampling, there is no specific criterion for selection. It is based on ease of access to the sample or practical convenience.
These days television hosts and radio stations often ask their viewers to go online to participate in polls or to give their opinions of a topic. Individuals volunteer to be part of the study. This procedure is called volunteer sampling. Volunteer sampling technique, even though convenient, has all the flaws of a nonprobability sampling technique. For example, one does not know who is participating in the study. Wimmer and Dominick (2010) note the unethical behavior of radio stations that respond to the volunteer call of competitive radio stations and intentionally provide fake information to cause them to make wrong decisions.
Judgment or expert sampling involves the subjective judgment of the researcher or an expert in selection of a sample.
In quota sampling, nonrandom sampling is done to fulfill a certain quota or limit. For example, if the researcher wants a sample of 100 individuals for a study and knows that the university population is 45 percent male and 55 percent female, he or she might sample until the quota of 45 males and 55 females is met. This is called proportional quota sampling. In nonproportional quota sampling one is not concerned with the sample proportions matching the population proportion. The goal is to have enough males and females to make up the sample of 100. Quota sampling is in some ways similar to stratified sampling, except that the selection is nonrandom and is based on ease of access.
Snowball sampling involves identifying someone who meets the criteria that the researcher is looking for and then asking him or her to recommend others who also meet the criteria. This technique is useful for studying populations that are not easily accessible, such as homeless individuals, drug dealers, and illegal or undocumented immigrants. Having access to such an individual and gaining his or her trust can help in getting access to others for the study.
Selecting a Sample Size
The most common dilemma for a researcher is to determine the sample size for the study. There is no consensus among researchers on the sample size. The frequent sample size one comes across for a national survey ranges from 1,000 to 1,500 participants, and for a local survey the size is about 500. Fowler (2009) suggests that sample size should be decided on a case-by-case basis, taking into account the margin of error the researcher is willing to tolerate and the level of precision he or she wants. Wimmer and Dominick (2010) list seven factors that determine the sample size: project type, purpose, and complexity; amount of error tolerated; time and financial constraints; and previous research on the topic area. There are many books on statistics that contain charts or published tables and formulas that can help media researchers determine the size of the sample for their study (see Comrey & Lee, 1992; Fowler, 2009; Krejcie & Morgan, 1970). In addition, sampling statisticians can also guide media researchers in this area.
Designing a Questionnaire
Designing a questionnaire to collect data from sample respondents is an important part of survey design. The key issues in questionnaire development are what questions to ask and how to ask them, what measurement scales to use, and the appearance of the questionnaire.
The first and foremost issue in writing a good questionnaire is defining the key concepts one wishes to study. We often use the terms “attitudes,” “values,” “beliefs,” “liberal,” “conservative,” “self-esteem,” and so on in our daily lives. However, understanding of the meaning of these terms differs from person to person. Media researchers need to clarify and clearly define these concepts for a common understanding between the researcher and the survey respondent.
Let's take the example of a researcher trying to study violence in video games. The term “violence” can mean different things to different individuals. For example, it can include physical, mental, verbal, and sexual violence. Even within physical violence, pushing and shoving is not the same as shooting, murder, and rape. Thus a questionnaire eliciting a response on violence in video games might get varied responses based on the individual's understanding of the concept. It is thus important for a researcher to provide a conceptual and an operational definition of the concepts he or she is trying to study.
A conceptual definition includes identifying and defining key constructs of a concept. For example, what do the concepts “attitude” and “violence” mean? One can use the definitions used by other scholars or, when necessary, come up with a new definition. For example, Gerbner and his colleagues defined violence as “an overt expression of physical force against self or other, compelling action against ones will on pain of being hurt or killed, or actually hurting or killing” (Signorielli, Gross, & Morgan, 1982, p. 163). Similarly, the concept of “attitude” toward advertising can be defined as “a learned predisposition to respond in the consistently favorable or unfavorable manner to advertising in general” (Lutz, 1985, p.53).
When measuring a concept in a cross-cultural media research, the researcher needs also to establish conceptual equivalency. For example, the concept of “family” differs in different parts of the world. Family in the United States usually refers to a nuclear family, in which there is a mother, a father, and children, but in many Asian countries “family” may include uncles, aunts, grandparents, and cousins (Mueller, 2010).
An operational definition involves creating actual measurements for a concept. For example, the concept of an “attitude” toward an ad can be measured by asking very specific questions, such as whether the ad was good, interesting, informative, appropriate, easy to understand, and objective (Henthorne, Latour, & Nataraajan, 1993). When measuring a concept, the researcher should make sure the measurements are reliable and valid. Reliability refers to the consistency of the measure. In other words, if the same measure is used multiple times to measure a concept, it should consistently yield the same result, just as a good weighing scale does when measuring the weight of a person. Validity refers to the accuracy of the measurement: is the measurement measuring what it is supposed to measure? If a researcher is trying to study attitudes but is measuring behaviors, the measurement is not valid.
When it comes to measurement of variables, it is not always necessary to develop one's own measurement scales. Many researchers find it convenient to use standard measurement scales created by other researchers in the fields of mass communication, sociology, psychology, and market research instead of creating their own scales for measuring concepts. There are many handbooks on measurement scales that media survey researchers can use, for example, Handbook of Marketing Scales: MultiItem Measures for Marketing and Consumer Behavior Research, edited by Bearden, Netemeyer, and Kelly (2011); Measures of Personality and Social Psychological Attitudes, edited by Robinson, Shaver, and Wrightsman (1991); and Communication Research Measures: A Sourcebook, edited by Rubin, Palmgreen, and Sypher (2009). The advantages of these measurements are that they have been tested for their reliability and validity. However, they may not be suitable for the researcher's particular needs. In that case, the measurements have to developed or adapted.
Types of Questions
A survey researcher can ask open-ended or closed-ended questions. Open-ended questions elicit detailed answers from a respondent. The following questions are examples of open-ended questions:
- Tell me about. . .
- What do you think would happen if . . .?
- What television programs do you normally watch?
- Why did you vote for Hillary Clinton in the 2008 presidential election?
Closed-ended questions, on the other hand, ask respondents to select from a given set of options provided by the researcher. For example,
Please circle your choice by answering “yes” or “no” to the following question:
Did you vote for Hillary Clinton in the 2008 presidential election?
![]()
Levels of Measurements
Media researchers have the option of using various levels of measurement to measure variables. There are four levels of measurement: nominal, ordinal, interval, and ratio. The nominal level of measurement is the weakest or lowest level, followed by ordinal, interval, and ratio level, which is the highest or strongest level of measurement.
Nominal is the weakest level of measurement because attributes of a variable can only be put in categories and assigned numerical values. For example, the variable “sex” has two attributes, “male” and “female.” Here it is difficult to say which attribute ranks higher than the other. The kinds of statistical analyses that can be performed on a nominal level measurement are very limited.
The ordinal level of measurement is more precise than the nominal level. Here attributes of a variable can be ordered by rank but the distance between the attributes does not have any meaning. For example, respondents can be asked to rank their preference for a television program from 1 to 5. The researcher can then calculate which of the five programs is the most preferred of those given to respondents. However, he or she cannot conclude that the difference in preference for the television programs ranked 1 and 2 is the same as for those ranked 3 and 4.
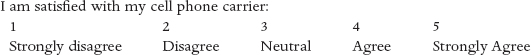
The interval measures distance between the attributes, distance that has meaning. In media studies, verbal rating scales such as the Likert scales and the semantic differential scales are the most commonly used of interval scales.
The Likert scale is a five-point scale that was initially used by Likert to measure intelligence in survey research. However, since then it has been used for measuring various other subjective ideas. In this scale, respondents normally indicate their level of agreement on a scale of 1 to 5. For example,
Osgood, Suci, and Tannenbaum (1957) developed the seven-point semantic differential scale. It is a bipolar scale with contrasting adjectives at each end of the scale, for example:
![]()
Ratio is the strongest and the most precise level of measurement. Ratio measurements have an absolute zero and the distance between the numbers is meaningful. For example, as on a measuring tape, the distance between 1 and 2 inches and between 2 and 3 inches is the same, and 2 inches is twice 1 inch. Income, age, years of experience, and length of stay are some examples of ratio level measurement. It is possible to have a zero income or zero years of experience. Ratio measurements allow for various kinds of mathematical calculations such as fractions, which can be useful for a researcher to gain precise insights.
Questionnaire Wording
In order to get complete and accurate information from the respondents, the questions should be clearly worded and free of jargon so that they mean the same thing to every respondent. Media studies, like other fields, has its jargon and abbreviations which most people outside the field do not understand. These should either be avoided or clearly explained to the respondents.
When writing a question, it is best to use natural and familiar language, and the researcher should avoid inadequate question wording or asking “loaded” or leading questions, double-barreled questions, or questions with double negatives, in order to reduce errors and bias in responses.
Inadequate question wording is when a researcher does not ask a complete question. For example, the specific question “What was your age on your last birthday?” instead of just “Age?” (Fowler, 2009, p. 89) would elicit a more accurate response.
“Loaded” or leading questions bias respondents to think and respond in a particular way. Loaded words are usually emotionally charged words that bring out a strong positive or negative reaction. Calling a plant a weed brings out negative reaction toward the plant. Other examples include: “bureaucrat”/“public servant,” “pro-life”/“pro-choice,” “regime”/“government,” “estate tax”/“death tax,” “undocumented workers”/“illegal aliens,” and “elitist”/“expert” (Heller, 2002; Luntz, 2006). Leading questions force respondents to answer in a particular way. For example, a question phrased as “Don't you agree that pilots should earn more money than they currently do?” leads respondents to answer in a particular way. It would be better to rephrase it as “Do you believe pilots' salaries are a little lower than they should be, a little higher than they should be, or about right?”
Double-barreled questions often address two or more issues in a single question, which makes it difficult for respondents to answer accurately. For example, “Do you want to be rich and famous?” (Fowler, 2009, p. 94) and “Do you think the city should build more schools and parks?” The respondent might want to be rich but not famous. He or she might support the idea of building more schools but not parks. But these two questions do not offer respondents the option of responding to the two issues separately. It is thus important to ask the questions separately. The use of the word “and” in a question should be evaluated.
Double-negative questions – for example, “I disagree that children should not be allowed to participate in reality television program” – are confusing to respondents because they use two negatives in one statement.
In addition to these, cross-cultural researchers have to understand language, language subtleties, and common usage of words, signs, and symbols in another country in order to write a good questionnaire. George Bernard Shaw famously said, “England and America are two countries separated by a common language.” People from English-speaking countries such as the United States, the United Kingdom, and Australia often discuss their experiences of misunderstanding some of the common expressions, phrases, and words in each other's country. Rubber can mean an eraser in one country (United Kingdom) and a condom in another (United States). Shoes can be called sneakers in one country (United States) and trainers in another (United Kingdom). Where language can be challenging even between English-speaking countries, the problem is compounded when designing a study for another country.
Language equivalency is important to establish in cross-cultural or global research. In global media research a master questionnaire is often designed, which is translated and used in different countries. In order to avoid mistakes relating to language and words, it is advisable to use the back-translation method (Brislin, 1970) to achieve accuracy in translation. In the back-translation method, two bilingual translators who are familiar with the source and target language are employed to translate the questions. One bilingual translator translates the questionnaire into the target language and the other translates it back to the source language to insure that there is no mistranslation. However, measurement errors can still arise because of the poor wording of questions, faulty cultural and other assumptions, and faulty scales.
In global surveys, questionnaires developed in one country should not be simply translated for use in another country. The researcher has to make sure that the concepts and scenarios presented in the questionnaire are understood by and relate to the local population in order to get results that are accurate and comparable. For example, Van Raaiji (1978) notes that measuring social responsibility by asking “‘A good citizen is responsible for shoveling the sidewalk in front of his home,’ . . . assumes private ownership of houses, one-family housing, and a climate with snow in winter, and is clearly not applicable in an African country” (p. 693). The researcher will have to measure social responsibility in a different way in African countries. Similarly, questions about race that are commonly asked in the United States might make people in countries like the United Kingdom and South Africa uncomfortable and thus affect the response the researcher gets. In France, it is illegal to classify people by ethnicity or to ask census questions on race. Race as a category is meaningful only for multicultural countries like the United States, but not so much for a comparatively homogeneous country like Japan.
Questionnaire Structure and Appearance
It is important to keep the questionnaire simple and easy to read so respondents are not overwhelmed. Short instructions on how to answer the questions help the respondent. The opening questions should be easy, nonintrusive, nonthreatening, pertain to the respondent, and require little effort on the part of the respondent. This encourages them to continue.
A lot of white space on a questionnaire, a clear typeface, and logical flow from one topic to another help produce a better response. The flow of the questionnaire can be based on subject or topic areas, chronology, or any other criteria. It is better to move from general to more specific questions related to a topic area. Respondents often feel frustrated if they have to keep shifting back and forth between one topic and another.
Survey researchers often use contingency questions to help guide respondents through a questionnaire. Contingency questions act as a filter and allow respondents to skip questions that do not relate to them. For example, “Do you watch the television program Big Brother? If ‘Yes,’ please continue. If ‘No’ skip to question number 5.” Even though contingency questions are helpful, they should be used only when necessary; too many skips can confuse respondents.
It has also been noted that survey respondents get tired, bored, uninterested, and unmotivated after going through a series of questions. When this happens, respondents tend to answer “Don't know,” engage in “straight line” responding (i.e., choose answers from the same column on a page), give more perfunctory answers, or give up answering the questionnaire altogether (Ben-Nun, 2008). In order to avoid responding fatigue, it is important to have a variety of questions. On a scale using a large set of agree/disagree items, item reversal (see Paulhus 1991) can help the respondent to pay attention and prevent straight-line responses.
After designing the questionnaire, it is important to pretest or pilot-test the survey before collecting the data. This will help identify the problems with the questionnaire before it is used.
Challenges in Survey Methodology
Survey methodology relies heavily on self-report or other-report and thus inaccuracies often arise due to the misreading of questions by respondents, inadequate knowledge, faulty or invalid answers, and inability to recall incidents, products, or advertising. According to De Mooij (2010, p. 143), “[p]eople may sometimes not say what they think; they may distort their answers for various psychological or cultural reasons or misinterpret some questions. The way questions are formulated can cause bias. The answers may not accurately reflect people's feelings or behaviors in actual social settings.”
Telephone surveys, which were once quite popular when people had landlines and one national telephone company monopolized the market, are becoming less popular with the growth of mobile phones and for a number of other reasons. Researchers no longer have one good sampling frame to study households, as mobile telephone numbers are not attached to a geographic location but to a mobile individual. Today there are multiple carriers, and people transfer their number across state lines, thus making it difficult to have a good sampling frame. In addition, the nonresponse rate seems to be higher for mobile phones than for landlines, perhaps because people have a greater ability to screen calls (American Association for Public Opinion Research, 2008). In addition, the Do Not Call registry in the United States, and the Telephone Preference Service in the United Kingdom, prevent telephone survey researchers from calling a larger number of people who do not wish to be contacted. This further affects the sample frame. Groves (2011, p. 869) notes, “Although there appears to be a broad consensus among survey methodologists that we are moving to a future of mixed-mode surveys, the current available mix does not solve the problem of falling response rates in a permanent way.”
Managing Response Rate
In survey research it is important to reach and collect data from every individual in the sample. Failure to do so results in errors and skewed findings. Response rate is affected when respondents do not answer a particular question on a questionnaire or do not fill in the questionnaire at all. Response rate is also affected when the survey does not research the respondent (noncontact), or when the respondent is unwilling or unable to participate due to illness or other reasons (nonresponse). These result in nonresponse errors. Repeated calling of unanswered telephone numbers or repeated contacting of eligible respondents can improve response rate. For more details on improving response rate, see Groves, Dillman, Eltinge, and Little (2002) and Dillman (2007). Response rate is important for researchers to report so that readers can evaluate the quality of the research. The simplest way to calculate response rate is by dividing the number of people who completed the survey by the total number of individuals or units in the sample.
In survey research, there is no consensus on what response rate is acceptable (American Association for Public Opinion Research, n.d.; Fowler, 2009; Langer, 2003). The American Community Survey reports a high response rate of 97.6 percent (US Census, 2013). Many surveys can be found with a response rate as low as 20 percent. The Division of Instructional Innovation and Assessment at University of Texas at Austin (2007) notes, “acceptable response rates vary by how the survey is administered.” For mail surveys DIIA notes, 50 percent response rate is considered adequate, 60 percent is good, and 70 percent is very good. For phone surveys, 80 percent is considered good; for email surveys, 40 percent response rate is considered average, 50 percent is good, 60 percent is very good; for online surveys, 30 percent is considered average; and for face-to-face surveys, 80–85 percent is considered good.
As mentioned, cross-cultural survey researchers face additional challenges. One such challenge deals with the use of standard measurement scales. De Mooij (2010) notes that this might be problematic as the conceptual model on which the measurements scales are developed often do not relate to another country in the same way. In addition, people in different countries differ in their response styles (Baumgartner & Steenkamp, 2001). For example, Italians have an extreme response style (ERS) in that they tend to choose extreme points in verbal rating scales and Germans tend to mark toward the middle (De Mooij, 2010). Thus a “completely agree answer in Italy is not worth the same as completely agree answer in Germany” (De Mooij, 2010, p. 147). Similarly respondents in the United States tend to start from extreme positions on a verbal rating scale of “excellent” to “terrible” and then move inwards, while the Japanese respondents start with a neutral point and work outwards, rarely taking an extreme position (Fields, quoted in Mueller, 2010). Thus establishing metric or measurement equivalency is often difficult.
Conducting Ethically Sound Survey Research
Survey research methodology can yield valuable information that can help in making important decisions. Thus survey researchers need not only to follow the best procedures for conducting a survey, but should also conduct the surveys ethically so that no harm comes to respondents. Survey researchers also have an ethical obligation to their client for whom they are conducting research, to the interviewers, and to the company or institution for which they are conducting the survey.
The researcher needs to be open and honest with the client about the study, how it will be conducted, who will be surveyed, and how much time and cost will be involved. If any issue arises and compromises are made along the way, those need to be communicated to the client. The report to the client should be an accurate reflection of the data and not based on what the client hopes to hear. The researcher also has an ethical obligation toward those who work for him or her. The researcher needs to train the interviewers well so that they can conduct the survey in a professional manner. The researcher also needs to deal with any safety and security concerns of the interviewers. Interviewers should not be pressured into going into areas that are not safe. Finally, the researcher needs to do his or her job professionally and with the highest ethical standards in order to help his or her company or institution gain credibility and reputation.
In the United States, in order to protect the research participants, studies done in universities have to be approved by the institutional review board (IRB) before they can be conducted. The guidelines followed by the IRB for protecting human subjects come from the Belmont Report of 1979, which was put together after a series of research that were ethically compromised (US Department of Health & Human Services). The syphilis study in Tuskegee, Georgia (1932–1972), thalidomide use, radiation experiments (1940s–1960s), and the Milgram study (1963) are some wellknown studies that raised ethical concerns. After the publicity from the Tuskegee syphilis study, the National Research Act of 1974 was passed, which created the National Commission for the Protection of Human Subjects of Biomedical and Behavioral Research. The commission in its report articulated three principles for protection of human subjects: informed consent, assessment of risks and benefits to the participant, and fair procedures and outcomes in the selection of research subject. Even though most media survey research falls under the “exempt” category, the procedure for approval as well as protection of participants needs to be followed. If the research involves collecting data from a vulnerable population such as children, pregnant women, prisoners, and the mentally ill, extra precaution needs to be taken to protect these participants from risk or harm.
In survey research, informed consent means providing respondents with information about the study before getting their consent for voluntary participation. Informed consent often includes providing respondents with the name of the organization conducting the research, the name of the researcher, the name of the organization sponsoring the research, a brief description of the study and the purpose of the study, an indication the time it would take to fill out the survey, options to skip questions that respondents do not wish to answer, and information on how anonymity and confidentiality will be maintained (Fowler, 2009). These are often written in the consent form that the respondent reads and signs or consents to before participating in the survey.
Maintaining anonymity and confidentiality in survey research is extremely important to protect the participant from harm. Lack of anonymity and confidentiality can compromise a respondent. For example, a survey collecting workplace data can identify employees to the managers, putting their jobs in jeopardy. Thus, information about the respondent should not be shared with anyone other than the research team. Either personal identifiers such as names, emails, telephone numbers, and home or office addresses should not be collected, or the survey data and the identifying information should be kept separate. Data should be kept in a secure location, and any identifying information should be deleted or destroyed after the survey has been conducted.
In very small number of cases involving drugs and crimes, subpoenas (court orders) have been issued for records and data from the researcher. This can compromise confidentiality and the anonymity of the respondents. Thus it is important to destroy any identifying information as soon as it is no longer needed (Fowler, 2009). Second, a certificate of confidentiality should be obtained from state or federal agencies for protection from subpoenas if the research involves collecting data on biomedical or illegal activities (see Sieber, 1992, for more details). In the United States, government agencies such as the National Institutes of Health (NIH) and the Department of Health & Human Services issue certificates of confidentiality.
Ethical principles require that the clear benefits of the research to the research participants be stated. In survey research, the participant can get benefit from the process itself by feeling that he or she has contributed to the understanding of the topic. He or she can also gain benefits in the form of gifts, payments, or prizes. Gifts, payments, or prizes should not be so large as to compromise voluntary participation. People who need the money might feel compelled to participate even though it may not be in their best interest.
The ethical principle of justice articulated in the Belmont Report (US Department of Health & Human Services, 1979) requires fairness in procedures and outcomes in the selection of research subjects. This is particularly important for survey researchers because survey methodology involves selecting a sample for the study. The Belmont Report notes that the selection of subjects should not be such that it compromises fairness. It states that researchers should not
offer potentially beneficial research only to some patients who are in their favor or select only “undesirable” persons for risky research. Social justice requires that distinction be drawn between classes of subjects that ought, and ought not, to participate in any particular kind of research. . . Thus, it can be considered a matter of social justice that there is an order of preference in the selection of classes of subjects (e.g., adults before children) and that some classes of potential subjects (e.g., the institutionalized mentally infirm or prisoners) may be involved as research subjects, if at all, only on certain conditions.
In many developing countries, there are no strict standards or procedures articulated by the government for collecting data from human subjects. Researchers should still follow the best practices in protecting research participants and conduct their research ethically so that people's participation in research continues for the benefit of the society.
REFERENCES
Adams, R. C. (1989). Social survey methods for mass media research. Hillsdale, NJ: Erlbaum.
American Association for Public Opinion Research (AAPOR). (n.d.) Response rate – an overview. American Association for Public Opinion Research. Retrieved July 12, 2013, from http://www.aapor.org/Response_Rates_An_Overview1.htm
American Association for Public Opinion Research(AAPOR). (2008). AAPOR cell phone task force. Retrieved July 12, 2013, from http://www.aapor.org/uploads/Final_AAPOR_Cell_Phone_TF_report_041208.pdf
Aubrey, J. S. (2006). Effects of sexually objectifying media on self-objectification and body surveillance in undergraduates. Journal of Communication, 56(2), 366–386.
Baumgartner, H., & Steenkamp, J. E. M. (2001). Response styles in marketing research: A cross-national investigation. Journal of Marketing Research, 38(2), 143–156.
Bearden, W. O., Netemeyer, R. G., & Kelly, L. (Eds.). (2011). Handbook of marketing scales: Multi-item measures for marketing and consumer behavior research. Thousand Oaks, CA: Sage.
Ben-Nun, P. (2008). “Respondent fatigue.” In P. J. Lavrakas (Ed.), Encyclopedia of survey research methods (pp. 743–744). Thousand Oaks, CA: Sage.
Brislin, R. W. (1970). Back-translation for cross-cultural research. Journal of Cross-Cultural Psychology, 1(3), 185–216.
Centre for Longitudinal Studies. (n.d.). Welcome to the Millennium Cohort Study. Retrieved July 12, 2013, from http://www.cls.ioe.ac.uk/page.aspx?&sitesectionid=851&sitesectiontitle=Welcome+to+the+Millennium+Cohort+Study
Comrey, A. L., & Lee, H. B. (1992). A first course in factor analysis. Hillsdale, NJ: Erlbaum.
Converse, J. (2009). Survey research in the United States: Roots and emergence, 1890–1960. Piscataway, NJ: Transaction.
Choudhry, Y. A. (1986). Pitfalls in international marketing research: Are you speaking French like a Spanish cow? Akron Business and Economic Review, 17(4), 18–28.
De Mooij, M. (2010). Global marketing and advertising: Understanding cultural paradoxes. Thousand Oaks, CA: Sage.
Dillman, D. A. (2007). Mail and Internet surveys: The total design method (2nd ed.). New York, NY: Wiley.
Division of Instructional Innovation and Assessment (DIIA). (2007). Guidelines for maximizing response rates. University of Texas at Austin. Division of Instructional Innovation and Assessment, Instructional Assessment Resources. Retrieved July 19, 2013, from http://www.utexas.edu/academic/ctl/assessment/iar/teaching/gather/method/survey-Response.php
Douglas, S. P., & Craig, C. S. (1983). International marketing research. Englewood Cliffs, NJ: Prentice Hall.
Fowler, F. J. (2009). Survey research methods. Thousand Oaks, CA: Sage.
Gallup. (n.d.). George Gallup, 1901–1984. Retrieved July 12, 2013, from http://www.gallup.com/corporate/21364/George-Gallup-19011984.aspx
Gallup, G., & Rae, S. F. (1940). The pulse of democracy. New York, NY: Simon & Schuster.
Gerbner, G., & Gross, L. (1976). Living with television: The violence profile. Journal of Communication, 26(2), 173–199.
Gerbner, G., Gross, L., Morgan, M., & Signorielli, N. (1980). The “mainstreaming” of America: Violence profile no. 11. Journal of Communication, 30(3), 10–29.
Groves, R. M. (2011). Three eras of survey research. Public Opinion Quarterly, 75(5), 861–871.
Groves, R. M., Dillman, D. A., Eltinge, J. L., & Little, R. A. J. (Eds.). (2002). Survey nonresponse. New York, NY: Wiley.
Heller, R. (2002). High impact speeches: How to write and deliver words that move minds. Harlow, UK: Pearson Education.
Henthorne, T. L., Latour, M. S., & Nataraajan, R. (1993). Fear appeals in print advertising: An analysis of arousal and ad response. Journal of Advertising, 22(2), 59–69.
Katz, E., & Lazarsfeld, P. L. (1955). Personal influence. Glencoe, IL: Free Press.
Krejcie, R. V., & Morgan, D. W. (1970). Determining sample size for research activities. Educational and Psychological Measurement, 30, 607–610.
Langer, G. (2003). About response rates: Some unresolved questions. American Association for Public Opinion Research. Retrieved July 12, 2013, from http://www.aapor.org/Content/NavigationMenu/PollampSurveyFAQs/DoResponseRatesMatteR/Response_Rates_-_Langer.pdf
Lazarsfeld, P. F., Berelson, B., & Gaudet, H. (1948). The people's choice (2nd ed.). New York, NY: Columbia University Press.
Lippman, W. (1922). Public opinion. New York, NY: Harcourt Brace.
Luntz, F. (2006). Frank Luntz Republican playbook. Retrieved July 19, 2013, from http://www.politicalcortex.com/special/Luntz_NAL_Appendix_14_Words
Lutz, R. J. (1985). Affective and cognitive antecedents of attitude toward the ad: A conceptual framework. In L. F. Alwitt & A. A. Mitchell (Eds.), Psychological processes and advertising effects: Theory, research and application (pp. 45–63). Hillsdale, NJ: Erlbaum.
Martin, J. L. (1984). The genealogy of public opinion polling. Annals of the American Academy of Political and Social Science, 472(1), 12–23.
Merton, R. K. (1979). Remembering Paul Lazarsfeld. In R. K. Merton, J. S. Coleman, & P. H. Rossi (Eds.), Qualitative and quantitative social research: Papers in honor of Paul F. Lazarsfeld (pp. 19–22). New York, NY: Free Press.
Mueller, B. (2010). Dynamics of international advertising. New York, NY: Peter Lang.
Osgood, C. E., Suci, G. J., & Tannenbaum, P. H. (1957). The measurement of meaning. Urbana, IL: University of Illinois Press.
Paulhus, D. L. (1991). Measurement and control of response bias. In J. P. Robinson, P. R. Shaver, & L. S. Wrightman (Eds.), Measures of personality and social psychological attitudes (pp. 17–51). San Diego, CA: Academic Press.
Pew Research. (2013). Random digit dialing – our standard method. Retrieved July 12, 2013, from http://www.people-press.org/methodology/sampling/random-digit-dialing-ourstandard-method/
Rentz, J. O., Reynolds, F. D., & Stout, R. G. (1983). Analyzing changing consumption patterns with cohort analysis. Journal of Marketing Research, 20(1), 12–20.
Robinson, J. P., Shaver, P. R., & Wrightsman, L. S. (Eds.). (1991). Measures of personality and social psychological attitudes. San Diego, CA: Academic Press.
Rubin, R. B., Palmgreen, P., & Sypher, H. E. (2009). Communication research measures: A sourcebook. New York, NY: Routledge.
Sieber, J. E. (1992). Planning ethically responsible research: A guide for students and internal review boards. Applied Social Research Methods Series, vol. 31. Newbury Park, CA: Sage.
Signorielli, N., Gross, L., & Morgan, M. (1982). Violence in television programs: Ten years later. In D. Pearl, L. Bouthilet, & J. Lazar (Eds.), Television and social behavior: Ten years of scientific progress and implications for the eighties (pp. 158–173). Rockville, MD: National Institute of Mental Health.
Smith, T. W. (1980). American's most important problem: A trend analysis, 1946–1976. Public Opinion Quarterly, 44(2), 164–180.
US Census. (2013). Response rates – data. American community survey. Retrieved July 12, 2013, from http://www.census.gov/acs/www/methodology/response_rates_data/
US Department of Health & Human Services. (1979). Ethical principles and guidelines for the protection of human subjects of research. Belmont Report. Retrieved July 12, 2013, from http://www.hhs.gov/ohrp/humansubjects/guidance/belmont.html#xselect
Van Raaij, W. F. (1978). Cross-cultural research methodology: A case of construct validity. Advances in Consumer Research, 5(1), 693–710.
Wimmer, R. D., & Dominick, J. R. (2010). Mass media research: An introduction. Boston, MA: Wordsworth.