
Equity Analysis in a Complex Market
Scientists classify systems into three types— ordered, random, and complex. Ordered systems, such as the structure of diamond crystals or the dynamics of pendulums, are definable and predictable by relatively simple rules and can be modeled using a relatively small number of variables. Random systems like the Brownian motion of gas molecules or white noise (static) are unordered; they are the product of a large number of variables. Their behavior cannot be modeled and is inherently unpredictable.
Complex systems like the weather and the workings of DNA fall somewhere between the domains of order and randomness. Their behavior can be at least partly comprehended and modeled, but only with great difficulty. The number of variables that must be modeled and their interactions are beyond the capacity of the human mind alone. Only with the aid of advanced computational science can the mysteries of complex systems be unraveled.1
The stock market is a complex system.2 Stock prices are not completely random, as the efficient market hypothesis and random walk theory would have it. Some price movements can be predicted, and with some consistency. But stock price behavior is not ordered. It cannot be successfully modeled by simple rules or screens such as low price-to-earnings ratios (P/Es) or even by elegant theories such as the capital asset pricing model or arbitrage pricing theory. Rather, stock price behavior is permeated by a complex web of interrelated return effects. A model of the market that is complex enough to disentangle these effects provides opportunities for modeling price behavior and predicting returns.
This entry describes our approach to investing and its application to the stock selection, portfolio construction, and performance evaluation problems. We begin with the very basic question of how one should approach the equity market. Should one attempt to cover the broadest possible range of stocks, or can greater analytical insights be garnered by focusing on a particular subset of the market or a limited number of stocks? Each approach has its advantages and disadvantages. However, combining the two may offer the best promise of finding the key to unlocking investment opportunity in a complex market.
While covering the broadest possible range of stocks, a complex approach recognizes that there are significant differences in the ways different types of stocks respond to changes in both fundamentals and investor behavior. This requires taking into account the interrelationships between numerous potential sources of price behavior. Multivariate analysis disentangles the web of return-predictor relationships that constitutes a complex market and provides independent, additive return predictions that are more robust than the predictions from univariate analyses.
AN INTEGRATED APPROACH TO A SEGMENTED MARKET
While one might think that U.S. equity markets are fluid and fully integrated, in reality there are barriers to the free flow of capital. Some of these barriers are self-imposed by investors. Others are imposed by regulatory and tax authorities or by client guidelines.
Some funds, for example, are prohibited by regulation or internal policy guidelines from buying certain types of stock—non-dividend-paying stock, or stock below a given capitalization level. Tax laws, too, may effectively lock investors into positions they would otherwise trade. Such barriers to the free flow of capital foster market segmentation.
Other barriers are self-imposed. Traditionally, for example, managers have focused (whether by design or default) on distinct approaches to stock selection. Value managers have concentrated on buying stocks selling at prices perceived to be low relative to the company’s assets or earnings. Growth managers have sought stocks with above-average earnings growth not fully reflected in price. Small-capitalization managers have searched for opportunity in stocks that have been overlooked by most investors. The stocks that constitute the natural selection pools for these managers tend to group into distinct market segments.
Client preferences encourage this balkanization of the market. Some investors, for example, prefer to buy value stocks, while others seek growth stocks; some invest in both, but hire separate managers for each segment. Both institutional and individual investors generally demonstrate a reluctance to upset the apple cart by changing allocations to previously selected style managers. Several periods of underperformance, however, may undermine this loyalty and motivate a flow of capital from one segment of the market to another (often just as the out-of-favor segment begins to benefit from a reversion of returns back up to their historical mean).
The actions of investment consultants have formalized a market segmented into style groupings. Consultants design style indexes that define the constituent stocks of these segments and define managers in terms of their proclivity for one segment or another. As a manager’s performance is measured against the given style index, managers who stray too far from index territory are taking on extra risk. Consequently, managers tend to stick close to their style homes, reinforcing market segmentation.
An investment approach that focuses on individual market segments can have its advantages. Such an approach recognizes, for example, that the U.S. equity market is neither entirely homogeneous nor entirely heterogeneous. All stocks do not react alike to a given impetus, but nor does each stock exhibit its own, totally idiosyncratic price behavior. Rather, stocks within a given style, or sector, or industry tend to behave similarly to each other and somewhat differently from stocks outside their group.
An approach to stock selection that specializes in one market segment can optimize the application of talent and maximize the potential for outperformance. This is most likely true for traditional, fundamental analysis. The in-depth, labor-intensive research undertaken by traditional analysts can become positively ungainly without some focusing lens.
An investment approach that focuses on the individual segments of the market, however, presents some theoretical and practical problems. Such an approach may be especially disadvantaged when it ignores the many forces that work to integrate, rather than segment, the market.
Many managers, for example, do not specialize in a particular market segment but are free to choose the most attractive securities from a broad universe of stocks. Others, such as style rotators, may focus on a particular type of stock, given current economic conditions, but be poised to change their focus should conditions change. Such managers make for capital flows and price arbitrage across the boundaries of particular segments.
Furthermore, all stocks can be defined by the same fundamental parameters—by market capitalization, P/E, dividend discount model ranking, and so on. All stocks can be found at some level on the continuum of values for each parameter. Thus, growth and value stocks inhabit the opposite ends of the continuums of P/E and dividend yield, and small and large stocks the opposite ends of the continuums of firm capitalization and analyst coverage.
As the values of the parameters for any individual stock change, so too does the stock’s position on the continuum. An out-of-favor growth stock may slip into value territory. A small-cap company may grow into the large-cap range.
Finally, while the values of these parameters vary across stocks belonging to different market segments—different styles, sectors, and industries—and while investors may favor certain values—low P/E, say, in preference to high P/E—arbitrage tends to counterbalance too pronounced a predilection on the part of investors for any one set of values. In equilibrium, all stocks must be owned. If too many investors want low P/E, low-P/E stocks will be bid up to higher P/E levels, and some investors will step in to sell them and buy other stocks deserving of higher P/Es. Arbitrage works toward market integration and a single pricing mechanism.
A market that is neither completely segmented nor completely integrated is a complex market. A complex market calls for an investment approach that is 180 degrees removed from the narrow, segment-oriented focus of traditional management. It requires a complex, unified approach that takes into account the behavior of stocks across the broadest possible selection universe, without losing sight of the significant differences in price behavior that distinguish particular market segments.
Such an approach offers three major advantages. First, it provides a coherent evaluation framework. Second, it can benefit from all the insights to be garnered from a wide and diverse range of securities. Third, because it has both breadth of coverage and depth of analysis, it is poised to take advantage of more profit opportunities than a more narrowly defined, segmented approach proffers.
A Coherent Framework
To the extent that the market is integrated, an investment approach that models each industry or style segment as if it were a universe unto itself is not the best approach. Consider, for example, a firm that offers both core and value strategies. Suppose the firm runs a model on its total universe of, say, 3,000 stocks. It then runs the same model or a different, segment-specific model on a 500-stock subset of large-cap value stocks.
If different models are used for each strategy, the results will differ. Even if the same model is estimated separately for each strategy, its results will differ because the model coefficients are bound to differ between the broader universe and the narrower segment. What if the core model predicts GM will outperform Ford, while the value model shows the reverse? Should the investor start the day with multiple estimates of one stock’s alpha? This would violate what we call the law of one alpha.3
Of course, the firm could ensure coherence by using separate models for each market segment—growth, value, small-cap, linking the results via a single, overarching model that relates all the subsets. But the firm then runs into a second problem with segmented investment approaches: To the extent that the market is integrated, the pricing of securities in one segment may contain information relevant to pricing in other segments.
For example, within a generally well-integrated national economy, labor market conditions in the United States differ region by region. An economist attempting to model employment in the Northeast would probably consider economic expansion in the Southeast. Similarly, the investor who wants to model growth stocks should not ignore value stocks. The effects of inflation, say, on value stocks may have repercussions for growth stocks; after all, the two segments represent opposite ends of the same P/E continuum.
An investment approach that concentrates on a single market segment does not make use of all available information. A complex, unified approach considers all the stocks in the universe, value and growth, large and small. It thus benefits from all the information to be gleaned from a broad range of stock price behavior.
Of course, an increase in breadth of inquiry will not benefit the investor if it comes at the sacrifice of depth of inquiry. A complex approach does not ignore the significant differences across different types of stock, differences exploitable by specialized investing. What’s more, in examining similarities and differences across market segments, it considers numerous variables that may be considered to be defining.
For value, say, a complex approach does not confine itself to a dividend discount model measure of value, but examines also earnings, cash flow, sales, and yield value, among other attributes. Growth measurements to be considered include historical, expected, and sustainable growth, as well as the momentum and stability of earnings. Share price, volatility, and analyst coverage are among the elements to be considered along with market capitalization as measures of size.
At a deeper level of analysis, one must also consider alternative ways of specifying such fundamental variables as earnings or cash flow. Over what period does one measure earnings? If using analyst earnings expectations, which measure provides the best estimate of future real earnings? The consensus of all available estimates made over the past six months, or only the very latest earnings estimates? Are some analysts more accurate or more influential? What if a recent estimate is not available for a given company?4
Predictor variables are often closely correlated with each other. Small-cap stocks, for example, tend to have low P/Es; low P/E is correlated with high yield; both low P/E and high yield are correlated with dividend discount model (DDM) estimates of value. Furthermore, they may be correlated with a stock’s industry affiliation. A simple low-P/E screen, for example, will tend to select a large number of bank and utility stocks. Such correlations can distort naïve attempts to relate returns to potentially relevant predictors. A true picture of the return-predictor relationship emerges only after disentangling the predictors.
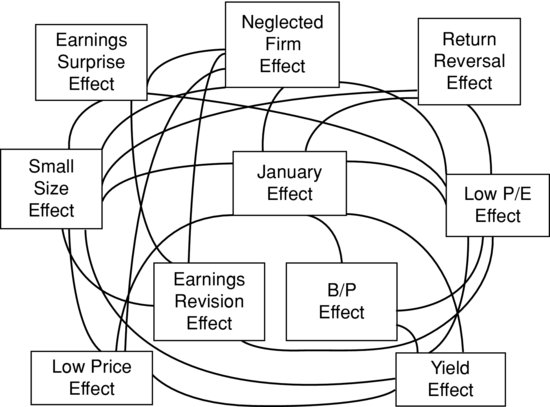
Figure 1 Return Effects Form a Tangled Web
DISENTANGLING
The effects of different sources of stock return can overlap. In Figure 1, the lines represent connections documented by academic studies; they may appear like a ball of yarn after the cat got to it. To unravel the connections between predictor variables and return, it is necessary to examine all the variables simultaneously.
For instance, the low-P/E effect is widely recognized, as is the small-size effect. But stocks with low P/Es also tend to be of small size. Are P/E and size merely two ways of looking at the same effect? Or does each variable matter? Perhaps the excess returns to small-cap stocks are merely a January effect, reflecting the tendency of taxable investors to sell depressed stocks at year-end. Answering these questions requires disentangling return effects via multivariate regression.5
Common methods of measuring return effects (such as quintiling or univariate, single-variable, regression) are naïve because they assume, naïvely, that prices are responding only to the single variable under consideration, low P/E, say. But a number of related variables may be affecting returns. As we have noted, small-cap stocks and banking and utility industry stocks tend to have low P/Es. A univariate regression of return on low P/E will capture, along with the effect of P/E, a great deal of noise related to firm size, industry affiliation, and other variables.
Simultaneous analysis of all relevant variables via multivariate regression takes into account and adjusts for such interrelationships. The result is the return to each variable separately, controlling for all related variables. A multivariate analysis for low P/E, for example, will provide a measure of the excess return to a portfolio that is market-like in all respects except for having a lower-than-average P/E ratio. Disentangled returns are pure returns.
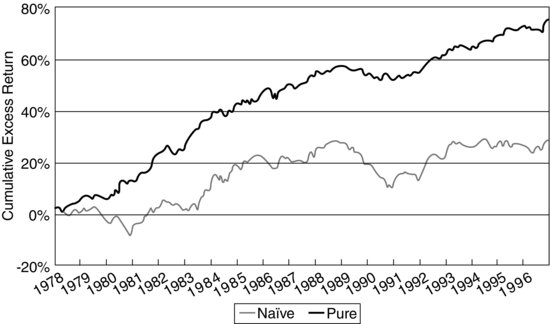
Figure 2 Naïve and Pure Returns to High Book-to-Price Ratio
Noise Reduction
Figure 2 plots naïve and pure cumulative monthly excess (relative to a 3,000-stock universe) returns to high book-to-price ratio (B/P). (Conceptually, naïve and pure returns come from a portfolio having a B/P that is one standard deviation above the universe mean B/P; for the pure returns, the portfolio is also constrained to have universe-average exposures to all the other variables in the model, including fundamental characteristics and industry affiliations.) The naïve returns show a great deal of volatility; the pure returns, by contrast, follow a much smoother path. There is a lot of noise in the naïve returns. What causes it?
Notice the divergence between the naïve and pure return series for the 12 months starting in March 1979. This date coincides with the crisis at Three Mile Island nuclear power plant. Utilities such as GPU, operator of the Three Mile Island power plant, tend to have high B/Ps, and naïve B/P measures will reflect the performance of these utilities along with the performance of other high-B/P stocks. Electric utility prices plummeted 24% after the Three Mile Island crisis. The naïve B/P measure reflects this decline.
But industry-related events such as Three Mile Island have no necessary bearing on the B/P variable. An investor could, for example, hold a high-B/P portfolio that does not overweight utilities, and such a portfolio would not have experienced the decline reflected in the naïve B/P measure in Figure 2. The naïve returns to B/P reflect noise from the inclusion of a utility industry effect. A pure B/P measure is not contaminated by such irrelevant variables.
Disentangling distinguishes real effects from mere proxies and thereby distinguishes between real and spurious investment opportunities. As it separates high B/P and industry affiliation, for example, it can also separate the effects of firm size from the effects of related variables. Disentangling shows that returns to small firms in January are not abnormal; the apparent January seasonal merely proxies for year-end tax-loss selling.6 Not all small firms will benefit from a January rebound; indiscriminately buying small firms at the turn of the year is not an optimal investment strategy. Ascertaining true causation leads to more profitable strategies.
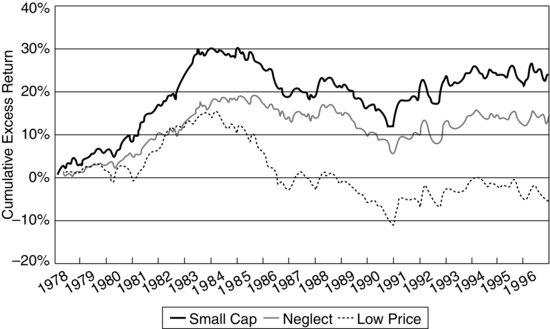
Figure 3 Naïve Returns Can Hide Opportunities (Three Size-Related Variables)
Return Revelation
Disentangling can reveal hidden opportunities. Figure 3 plots the naïvely measured cumulative monthly excess returns (relative to the 3,000-stock universe) to portfolios that rank lower than average in market capitalization and price per share and higher than average in terms of analyst neglect. These results derive from monthly univariate regressions. The small-cap line thus represents the cumulative excess returns to a portfolio of stocks naïvely chosen on the basis of their size, with no attempt made to control for other variables.
All three return series move together. The similarity between the small-cap and neglect series is particularly striking. This is confirmed by the correlation coefficients in the first column of Table 1. Furthermore, all series show a great deal of volatility within a broader up, down, up pattern.
Table 1 Correlations Between Monthly Returns to Size-Related Variables*
| Variable | Naïve | Pure |
| Small cap/low price | 0.82 | −0.12 |
| Small cap/neglect | 0.87 | −0.22 |
| Neglect/low price | 0.66 | −0.11 |
| *A coefficient of 0.14 is significant at the 5% level. | ||
Figure 4 shows the pure cumulative monthly excess returns to each size-related attribute over the period. These disentangled returns adjust for correlations not only between the three size variables, but also between each size variable and industry affiliations and each variable and growth and value characteristics. Two findings are immediately apparent from Figure 4.
Figure 4 Pure Returns Can Reveal Opportunities (Three Size-Related Variables)
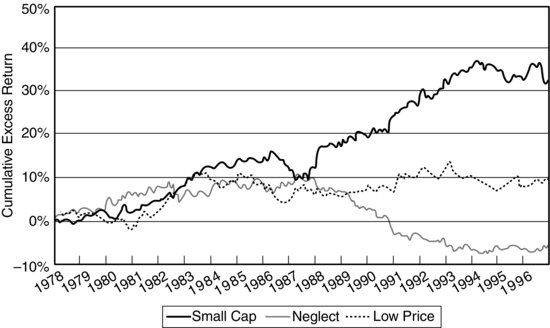
First, pure returns to the size variables do not appear to be nearly as closely correlated as the naïve returns displayed in Figure 3. In fact, over the second half of the period, the three return series diverge substantially. This is confirmed by the correlation coefficients in the second column of Table 1.
In particular, pure returns to small capitalization accumulate quite a gain over the period; they are up 30%, versus an only 20% gain for the naïve returns to small cap. Purifying returns reveals a profit opportunity not apparent in the naïve returns. Furthermore, pure returns to analyst neglect amount to a substantial loss over the period. Because disentangling controls for proxy effects, and thereby avoids redundancies, these pure return effects are additive. A portfolio could have aimed for superior returns by selecting small-cap stocks with a higher-than-average analyst following (that is, a negative exposure to analyst neglect).
Second, the pure returns appear to be much less volatile than the naïve returns. The naïve returns in Figure 3 display much month-to-month volatility within their more general trends. By contrast, the pure series in Figure 4 are much smoother and more consistent. This is confirmed by the standard deviations given in Table 2.
The pure returns in Figure 4 are smoother and more consistent than the naïve return responses in Figure 3 because the pure returns capture more signal and less noise. And because they are smoother and more consistent than naïve returns, pure returns are also more predictive.
Predictive Power
Disentangling improves the predictive power of estimated returns by providing a clearer picture of the relationships between investor behavior, fundamental variables, and macro- economic conditions. For example, investors often prefer value stocks in bearish market environments, because growth stocks are priced more on the basis of high expectations, which get dashed in more pessimistic eras. But the success of such a strategy will depend on the variables one has chosen to define value.
Table 2 Pure Returns Are Less Volatile, More Predictable: Standard Deviations of Monthly Returns to Size-Related Variables*
| Variable | Naïve | Pure |
| Small cap | 0.87 | 0.60 |
| Neglect | 0.87 | 0.67 |
| Low price | 1.03 | 0.58 |
| *All differences between naïve and pure return standard deviations are significant at the 1% level. | ||
Table 3 displays the results of regressing both naïve and pure monthly returns to various value-related variables on market (S&P 500) returns over the 1978–1996 period.7 The results indicate that DDM value is a poor indicator of a stock’s ability to withstand a tide of receding market prices. The regression coefficient in the first column indicates that a portfolio with a one-standard-deviation exposure to DDM value will tend to outperform by 0.06% when the market rises by 1.00% and to underperform by a similar margin when the market falls by 1.00%. The coefficient for pure returns to DDM is similar. Whether their returns are measured in pure or naïve form, stocks with high DDM values tend to behave procyclically.
Table 3 Market Sensitivities of Monthly Returns to Value-Related Variables
High B/P appears to be a better indicator of a defensive stock. It has a regression coefficient of −0.10 in naïve form. In pure form, however, B/P is virtually uncorrelated with market movements; pure B/P signals neither an aggressive nor a defensive stock. B/P as naïvely measured apparently picks up the effects of truly defensive variables, such as high yield.
The value investor in search of a defensive posture in uncertain market climates should consider moving toward high yield. The regression coefficients for both naïve and pure returns to high yield indicate significant negative market sensitivities. Stocks with high yields may be expected to lag in up markets but to hold up relatively well during general market declines.
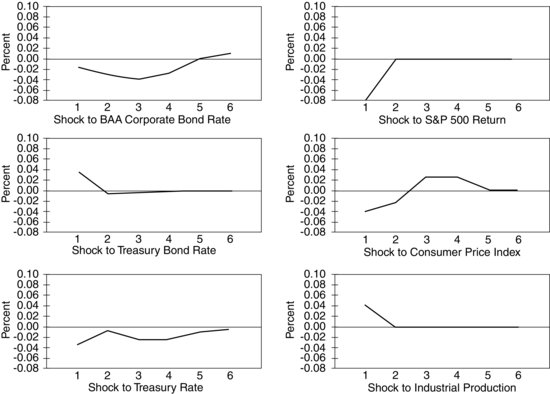
Figure 5 Forecast Response of Small Size to Macroeconomic Shocks
These results make broad intuitive sense. DDM is forward-looking, relying on estimates of future earnings. In bull markets, investors take a long-term outlook, so DDM explains security pricing behavior. In bear markets, however, investors become myopic; they prefer today’s tangible income to tomorrow’s promise. Current yield is rewarded.
Pure returns respond in intuitively satisfying ways to macroeconomic events. Figure 5 illustrates, as an example, the estimated effects of changes in various macroeconomic variables on the pure returns to small size (as measured by market capitalization). Consistent with the capital constraints on small firms and their relatively greater sensitivity to the economy, pure returns to small size may be expected to be negative in the first four months following an unexpected increase in the Baa corporate rate and positive in the first month following an unexpected increase in industrial production.8 Investors can exploit such predictable behavior by moving into and out of the small-cap market segment as economic conditions evolve.9
These examples serve to illustrate that the use of numerous, finely defined fundamental variables can provide a rich representation of the complexity of security pricing. The model can be even more finely tuned, however, by including variables that capture such subtleties as the effects of investor psychology, possible nonlinearities in variable-return relationships, and security transaction costs.
Additional Complexities
In considering possible variables for inclusion in a model of stock price behavior, the investor should recognize that pure stock returns are driven by a combination of economic fundamentals and investor psychology. That is, economic fundamentals such as interest rates, industrial production, and inflation can explain much, but by no means all, of the systematic variation in returns. Psychology, including investors’ tendency to overreact, their desire to seek safety in numbers, and their selective memories, also plays a role in security pricing.
What’s more, the modeler should realize that the effects of different variables, fundamental and otherwise, can differ across different types of stocks. The value sector, for example, includes more financial stocks than the growth sector. Investors may thus expect value stocks in general to be more sensitive than growth stocks to changes in interest rate spreads.
Psychologically based variables such as short-term overreaction and price correction also seem to have a stronger effect on value than on growth stocks. Earnings surprises and earnings estimate revisions, by contrast, appear to be more important for growth than for value stocks. Thus, Google shares can take a nosedive when earnings come in a penny under expectations, whereas Duke Energy shares remain unmoved even by fairly substantial departures of actual earnings from expectations.
The relationship between stock returns and relevant variables may not be linear. The effects of positive earnings surprises, for instance, tend to be arbitraged away quickly; thus positive earnings surprises offer less opportunity for the investor. The effects of negative earnings surprises, however, appear to be more long-lasting. This nonlinearity may reflect the fact that sales of stock are limited to those investors who already own the stock (and to a relatively small number of short-sellers).10
Risk-variable relationships may also differ across different types of stock. In particular, small-cap stocks generally have more idiosyncratic risk than large-cap stocks. Diversification is thus more important for small-stock than for large-stock portfolios.
Return-variable relationships can also change over time. Recall the difference between DDM and yield value measures: high-DDM stocks tend to have high returns in bull markets and low returns in bear markets; high-yield stocks experience the reverse. For consistency of performance, return modeling must consider the effects of market dynamics, the changing nature of the overall market.
The investor may also want to decipher the informational signals generated by informed agents. Corporate decisions to issue or buy back shares, split stock, or initiate or suspend dividends, for example, may contain valuable information about company prospects. So, too, may insiders’ (legal) trading in their own firms’ shares.
Finally, a complex model containing multiple variables is likely to turn up a number of promising return-variable relationships. But are these perceived profit opportunities translatable into real economic opportunities? Are some too ephemeral? Too small to survive frictions such as trading costs? Estimates of expected returns must be combined with estimates of the costs of trading to arrive at realistic returns net of trading costs.
CONSTRUCTING, TRADING, AND EVALUATING PORTFOLIOS
To maximize implementation of the model’s insights, the portfolio construction process should consider exactly the same dimensions found relevant by the stock selection model. Failure to do so can lead to mismatches between model insights and portfolio exposures.11
Consider a commercially available portfolio optimizer that recognizes only a subset of the variables in the valuation model. Risk reduction using such an optimizer will reduce the portfolio’s exposures only along the dimensions the optimizer recognizes. As a result, the portfolio is likely to wind up more exposed to those variables recognized by the model, but not the optimizer, and less exposed to those variables common to both the model and the optimizer.
Imagine an investor who seeks low-P/E stocks that analysts are recommending for purchase, but who uses a commercial optimizer that incorporates a P/E factor but not analyst recommendations. The investor is likely to wind up with a portfolio that has a less-than-optimal level of exposure to low P/E and a greater–than-optimal level of exposure to analyst purchase recommendations. Optimization using all relevant variables ensures a portfolio whose risk and return opportunities are balanced in accordance with the model’s insights. Furthermore, the use of more numerous variables allows portfolio risk to be more finely tuned.
Insofar as the investment process, both stock selection and portfolio construction, is model-driven, it is more adaptable to electronic trading venues. This should benefit the investor in several ways. First, electronic trading is generally less costly, with lower commissions, market impact, and opportunity costs. Second, it allows real-time monitoring, which can further reduce trading costs. Third, an automated trading system can take account of more factors, including the urgency of a particular trade and market conditions, than individual traders can be expected to bear in mind.
Finally, the performance attribution process should be congruent with the dimensions of the selection model (and portfolio optimizer). Insofar as performance attribution identifies sources of return, a process that considers all the sources identified by the selection model will be more insightful than a commercial performance attribution system applied in a one-size-fits-all manner. Our investor who has sought exposure to low P/E and positive analyst recommendations, for example, will want to know how each of these factors has paid off and will be less interested in the returns to factors that are not a part of the stock selection process.
A performance evaluation process tailored to the model also functions as a monitor of the model’s reliability. Has portfolio performance supported the model’s insights? Should some be reexamined? Equally important, does the model’s reliability hold up over time? A model that performs well in today’s economic and market environments may not necessarily perform well in the future. A feedback loop between the evaluation and the research/modeling processes can help ensure that the model retains robustness over time.
PROFITING FROM COMPLEXITY
H. L. Mencken is supposed to have noted, “For every complex problem, there is a simple solution, and it is almost always wrong.” Complex problems more often than not require complex solutions.
A complex approach to stock selection, portfolio construction, and performance evaluation is needed to capture the complexities of the stock market. Such an approach combines the breadth of coverage and the depth of analysis needed to maximize investment opportunity and potential reward.
Grinold presents a formula that identifies the relationships between the depth and breadth of investment insights and investment performance:12
![]()
IR is the manager’s information ratio, a measure of the success of the investment process. IR equals annualized excess return over annualized residual risk (e.g., 2% excess return with 4% tracking error provides 0.5 IR). IC, the information coefficient, or correlation between predicted and actual security returns, measures the goodness of the manager’s insights, or the manager’s skill. BR is the breadth of the strategy, measurable as the number of independent insights upon which investment decisions are made.
One can increase IR by increasing IC or BR. Increasing IC means coming up with some means of improving predictive accuracy. Increasing BR means coming up with more “investable” insights. A casino analogy may be apt (if anathema to prudent investors).
A gambler can seek to increase IC by card counting in blackjack or by building a computer model to predict probable roulette outcomes. Similarly, some investors seek to outperform by concentrating their research efforts on a few stocks: by learning all there is to know about Microsoft, for example, one may be able to outperform all the other investors who follow this stock. But a strategy that makes a few concentrated stock bets is likely to produce consistent performance only if it is based on a very high level of skill, or if it benefits from extraordinary luck.
Alternatively, an investor can place a larger number of smaller stock bets and settle for more modest returns from a greater number of investment decisions. That is, rather than behaving like a gambler in a casino, the investor can behave like the casino. A casino has only a slight edge on any spin of the roulette wheel or roll of the dice, but many spins of many roulette wheels can result in a very consistent profit for the house. Over time, the odds will strongly favor the casino over the gambler.
A complex approach to the equity market, one that has both breadth of inquiry and depth of focus, can enhance the number and the goodness of investment insights. A complex approach to the equity market requires more time, effort, and ability, but it will be better positioned to capture the complexities of security pricing. The rewards are worth the effort.
KEY POINTS
- Ordered systems are definable and predictable by relatively simple rules; random systems cannot be modeled and are inherently unpredictable; complex systems can be at least partly comprehended and modeled, but only with difficulty.
- Stock price behavior is permeated by a complex web of interrelated return effects, and it requires a complex approach to stock selection, portfolio construction, and performance evaluation to capture this complexity.
- A complex approach combines the breadth of coverage and the depth of analysis needed to maximize investment opportunity and potential reward.
- Simple methods of measuring return effects (such as quintiling or univariate, single-variable regression) are naïve because they assume that prices are responding only to the single variable under consideration.
- Simultaneous analysis of all relevant variables via multivariate regression takes into account and adjusts for interrelationships between effects, giving the return to each variable separately.
- Disentangling distinguishes real effects from mere proxies and thereby distinguishes between real and spurious investment opportunities.
- Because disentangling controls for proxy effects, pure return effects are additive, each having the potential to improve portfolio performance.
- In general, disentangling enhances the predictive power of estimated returns by providing a clearer picture of the relationships between investor behavior, fundamental variables, and macroeconomic conditions.
- To maximize implementation of insights gained from disentangling the market’s complexity, the portfolio construction process should consider exactly the same dimensions found relevant by the stock selection process.
- Performance attribution should be congruent with the stock selection and portfolio construction processes so that it can be used to monitor the reliability of the stock selection process and provide input for research.
NOTES
1. See Pagels (1988) and Wolfram (2002).
2. Jacobs and Levy (1989a).
3. See Jacobs and Levy (1995b).
4. See Jacobs, Levy, and Krask (1997).
5. See Jacobs and Levy (1988b).
6. Jacobs and Levy (1988a).
7. Jacobs and Levy (1988c).
8. See Jacobs and Levy (1989b).
9. Jacobs and Levy (1996).
10. See Jacobs and Levy (1993).
11. See Jacobs and Levy (1995a).
12. Grinold (1989).
REFERENCES
Grinold, R. C. (1989). The fundamental law of active management. Journal of Portfolio Management 15, 3: 30–37.
Jacobs, B. I., and Levy, K. N. (1988a). Calendar anomalies: Abnormal returns at calendar turning points. Financial Analysts Journal 44, 6: 28–39.
Jacobs, B. I., and Levy, K. N. (1988b). Disentangling equity return regularities: New insights and investment opportunities. Financial Analysts Journal 44, 3: 18–44.
Jacobs, B. I., and Levy, K. N. (1988c). On the value of ‘value.’ Financial Analysts Journal 44, 4: 47–62.
Jacobs, B. I., and Levy, K. N. (1989a). The complexity of the stock market. Journal of Portfolio Management 16, 1: 19–27.
Jacobs, B. I., and Levy, K. N. (1989b) Forecasting the size effect. Financial Analysts Journal 45, 3: 38–54.
Jacobs, B. I., and Levy, K. N. (1993). Long/short equity investing. Journal of Portfolio Management 20, 1: 52–63.
Jacobs, B. I., and Levy, K. N. (1995a). Engineering portfolios: A unified approach. Journal of Investing 4, 4: 8–14.
Jacobs, B. I., and Levy, K. N. (1995b). The law of one alpha. Journal of Portfolio Management 21, 4: 78–79.
Jacobs, B. I., and Levy, K. N. (1996). High definition style rotation. Journal of Investing 6, 1: 14–23.
Jacobs, B. I., Levy, K. N., and Krask, M. C. (1997). Earnings estimates, predictor specification, and measurement error. Journal of Investing 6, 4: 29–46.
Pagels, H. (1988). The Dreams of Reason: The Computer and the Rise of the Sciences of Complexity. New York: Simon & Schuster.
Wolfram, S. (2002). A New Kind of Science. Champaign, IL: Wolfram Media Inc.