
Basics of Quantitative Equity Investing
The goal of this entry is to provide the basics of quantitative equity investing and an explanation of the quantitative investing process. More specifically, I focus on the following three questions. First, how do quantitative and fundamental equity investors differ? Second, what are the core steps in a quantitative equity investment process? Finally, what are the basic building blocks used by quantitative equity investors?
In answering these questions, I will pull back the curtain on the quantitative equity investment process, showing how it is similar to many other approaches, all searching for the best stocks. Where it differs is in the creation of a repeatable process that uses several key criteria to find the most attractive companies—its stock selection model. Finally, some of the most common techniques used by quantitative equity investors are covered.
It is important to understand that this entry is dedicated to a traditional quantitative equity investing approach. There are many other types of investing that are quantitative in nature (e.g., high-frequency trading, statistical arbitrage, etc.), which will not be covered.
EQUITY INVESTING
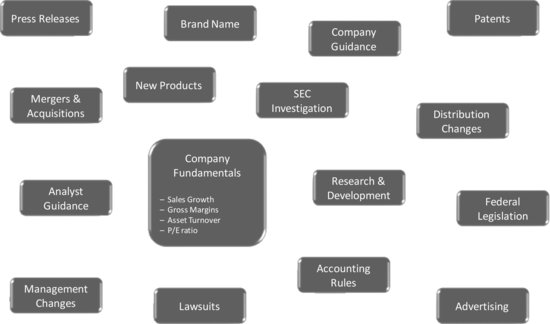
Investing can take many forms, but it starts with an investor assigning a value to a security. Whether this value exceeds or is less than the current market price usually determines whether the investor will buy or sell the security. In the case of equities, the investor often seeks to understand the specific company under consideration, the broader economic environment, and the interplay between the two. This encompasses a wide range of information for the investor to consider as displayed in Figure 1. How this information is used differentiates the quantitative from the fundamental investor.
Figure 1 The Value of a Stock Comes from Multiple Information Sources
FUNDAMENTAL VS. QUANTITATIVE INVESTOR
Let’s start with a basic question. How do portfolio managers select stocks from a broad universe of 1,000 or more companies?
Fundamental managers start with a basic company screen. For instance, they may first look for companies that satisfy conditions such as a price-earnings (P/E) ratio that is less than 15, earnings growth greater than 10%, and profit margins in excess of 20%. Filtering by those characteristics may result in, say, 200 potential candidates. Next, portfolio managers in consultation with their group of stock analysts will spend the majority of their time thoroughly reviewing each of the potential candidates to arrive at the best 50 to 100 stocks for their portfolio. Quantitative managers, in contrast, spend the bulk of their time determining the characteristics for the initial stock screen, their stock selection model. They will look for five or more unique characteristics that are good at identifying the most attractive 200 stocks of the universe. Quantitative managers will then purchase all 200 stocks for their portfolio.
So let’s expand on how these two investors— fundamental and quantitative—differ. Figure 2 details the main attributes of the two approaches discussed further below.
Figure 2 Fundamental vs. Quantitative Investor: Viewing Information
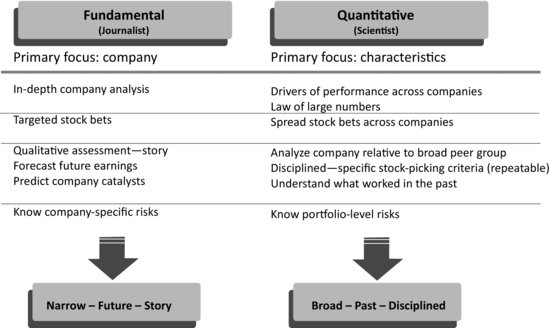
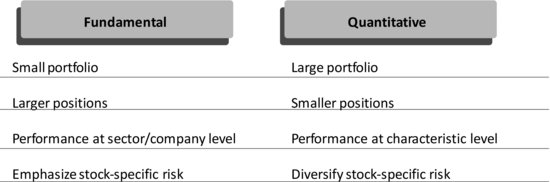
Figure 3 Fundamental vs. Quantitative Investor: Process Differences
In the end, we have two types of investors viewing information, often the same information, quite differently. The fundamental investor is a journalist focused on crafting a unique story of a company’s future prospects and predicting the potential for gain in the company’s stock. The quantitative investor is a scientist, broadly focused, relying on historical information to differentiate across all companies, using statistical techniques to create a stock selection model.
These two investors can and often do create different portfolios based on their different approaches as shown in Figure 3. Fundamental investors are more focused, with higher conviction in their stocks resulting in fewer, larger positions in their portfolios. Quantitative investors, reviewing a large group of companies, generally take a large number of smaller positions in their portfolio. Fundamental investors are investing in a stock (or sector) and therefore are most concerned with how much each of their stocks (or sectors) is contributing to performance. Quantitative investors are investing in a characteristic and how well it differentiates stocks. They want to know how each of their characteristics is contributing to performance. Finally, fundamental investors’ detailed view into the company allows them to understand the intrinsic risk of each investment they make—the potential stumbling blocks for each company. Quantitative investors’ goal is to understand specific characteristics across a broad universe of stocks. They look at risks across their entire portfolio, attempting to diversify away any firm-specific risks ancillary to their strategy.
Figure 4 Benefits of a Combined Fundamental and Quantitative Approach
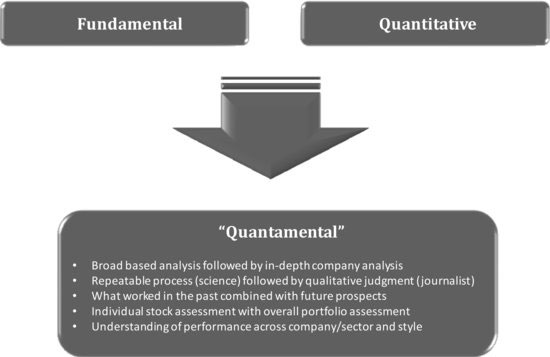
Now that you understand the basic differences between the two approaches, it might also be clear how using both investment styles can be very appealing. As Figure 4 shows, the two styles are quite complementary in nature and can provide a robust, well-rounded view of a company or portfolio. Combining the two approaches provides the following benefits:
- Breadth and depth. In-depth analysis across a large group of stocks selecting the best subset of companies, which is followed by in-depth review of the small subset of attractive companies.
- Facts balanced with human insight. The scientific approach reviewing large amounts of data across many companies complemented by personal judgment at the company level.
- Past and future perspective. A detailed historical review of companies combined with a review of future potential prospects of a company.
- Full risk analysis. A broad look at risk both within each company owned and across the entire portfolio.
- Clear portfolio performance. A thorough understanding of which companies, sectors, and characteristics are driving a portfolio’s performance.
In fact, over the years, the defining line between the two approaches has been blurring. Some have coined a term for this joint process: “quantamental.” Many investment managers are combining both approaches in one investment process, which is why whether you are a fundamental or quantitative investor, it is important to understand both perspectives.
Given our preceding discussion, the distinction between the quantitative and fundamental approaches should now be better appreciated. In the remainder of this entry we restrict our focus to the quantitative equity investment process, addressing the last two topics listed at the beginning of this entry: the core steps in a quantitative equity investment process and some of the basic building blocks used by quantitative investors.
THE QUANTITATIVE STOCK SELECTION MODEL
Before diving into the details of the quantitative investment process, let’s look at what is at its core—the stock selection model. As explained in the previous section, the quantitative investment approach is rooted in understanding what separates strong-performing stocks from weak-performing stocks.1 The quantitative investor looks for sources of information or company characteristics (often referred to as factors or signals)2 that help to explain why one stock outperforms another stock. They assemble these characteristics into a stock selection model, which can be run daily to provide an updated view on every stock in their investment universe.
The stock selection model is at the heart of the quantitative process. To build the model, the quantitative investor will look throughout history and see what characteristics drive performance differences between stocks in a group such as a universe (i.e., small cap, small-cap value, and large-cap growth) or a sector (i.e., technology, financials, materials).
The quantitative investor’s typical stock selection methodology is buying stocks with the most attractive attributes and not investing in (or shorting, if permitted by investment guidelines) stocks with the least attractive attributes. For instance, let’s suppose retail stocks that have the highest profitability tend to have higher stock returns than those with the lowest profitability. In this case, if a retail stock had strong profitability, there is a greater chance a portfolio manager would purchase it. Profitability is just one characteristic of a company. The quantitative investor will look at a large number of characteristics, from 25 to over 100, to include in the stock selection model. In the end, they will narrow their final model to a few characteristics that are best at locating performance differences among stocks in a particular universe or sector.
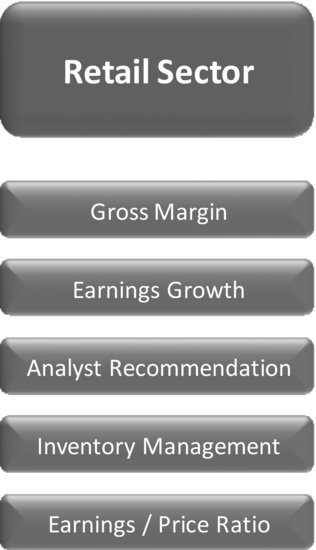
Figure 5 is an example of a stock selection model for the retail sector. If a stock has good margins and positive earnings growth, sell-side analysts like it, solid inventory management and is attractively valued, especially as pertains to earnings, then the quantitative investor would buy it. And if it did not have these characteristics, a quantitative investor would not own it, sell it, or short it. This example is for a retail sector; a quantitative investor could also have different models to select stocks in the bank sector or utilities sector or among small-cap value stocks.
Figure 5 Sample Stock Selection Model for the Retail Sector
So how does a quantitative investor create and use the stock selection model? A good analogy is a professional golfer. Like a quantitative investor, golfers create a model of their game. First, golfers analyze all elements of their basic swing from backswing to follow through. They then alter their swing to different conditions (high winds, rain, cold), and different course types (links, woodlands, fast greens). Next, golfers put their model into action. While they are golfing, they make mental notes about what is and isn’t working to help enhance their game. Could they tweak their swing? What has been effective under the current weather conditions? How are they playing this type of course?
Figure 6 Three Core Phases of the Quantitative Equity Investment Process
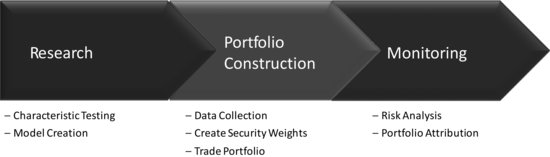
Overall, the golfers’ process is much like quantitative investors’ process. They create a model, implement it, and then monitor it, assessing their ability to shoot below par. Like professional golfers who go to the driving range for countless hours to perfect their swing, quantitative investors will spend countless hours perfecting their model, understanding how it works under many different market (weather/course) conditions.
With that analogy in mind, we now turn to the entire quantitative investment process.
THE OVERALL QUANTITATIVE INVESTMENT PROCESS
The quantitative process can be divided into the following three main phases (shown in Figure 6):
- Research
- Portfolio construction
- Monitoring
During the research phase, the stock selection model is created. During the portfolio construction phase, the quantitative investor “productionalizes” the stock selection model or gets it ready to invest in a live portfolio. Finally, during the monitoring phase, the quantitative investor makes sure the portfolio is performing as expected.
RESEARCH
Let’s start with the research phase since it is the basic building block of the quantitative process. It is where the fact-finding mission begins. This is similar to when the golfer spends countless hours at the driving range perfecting his (or her) swing. In this phase, the quantitative investor determines what aspects of a company make its stock attractive or unattractive. The research phase begins by the quantitative investors testing all the characteristics they have at their disposal, and it finishes with assembling the chosen characteristics into a stock selection model (see Figure 7).
Figure 7 Two Core Steps in the Research Phase of the Quantitative Equity Investment Process
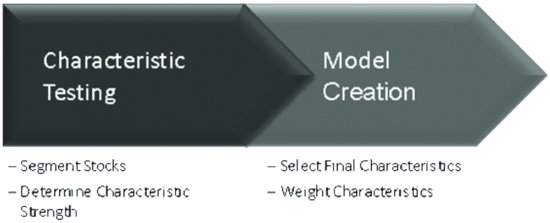
Figure 8 Characteristic Testing in the Research Phase
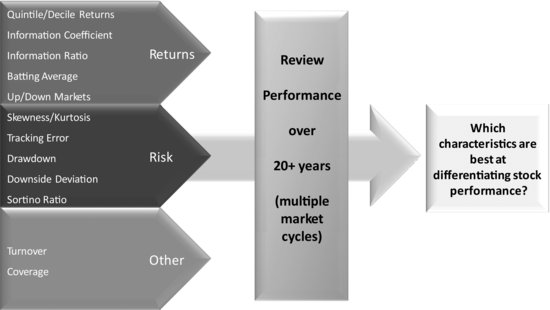
During the research phase, the quantitative investor tries to get a broad picture of a characteristic, making sure it performs well under a diverse set of conditions and performance measures. For testing, the quantitative investor looks at historical information over 20 years or more in order to cover multiple market cycles. While testing, many performance metrics are reviewed to get an expansive view of a characteristic’s ability to differentiate stocks. These metrics span the return category, risk category, and other metrics as outlined in Figure 8. Using an array of metrics, quantitative investors are better able to confirm a characteristic’s consistency. They make sure that the selected characteristics score well on more than a single metric. Before continuing with the research process, let’s review a few of the more commonly used metrics.
Characteristic Testing: Key Quantitative Research Metrics
In this section we will review quintile returns and information coefficients, which measure whether a characteristic can differentiate between winning and losing stocks. Although profitability was chosen for the examples, other characteristics such as sales growth, P/E ratio, or asset turnover also could have been chosen.
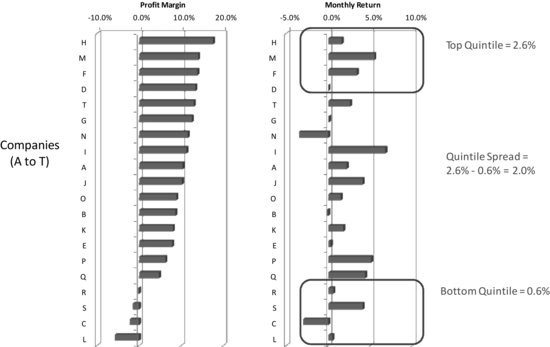
Figure 9 Determining the Characteristic’s Quintile Spread
Quintile Returns
The quintile return is already prevalent across most research publications, but is gaining popularity in more and more mainstream publications such as the Wall Street Journal, Barron’s, and the like. Quintile returns measure how well a characteristic differentiates stocks. In essence, the stocks that are being reviewed are segmented into five groups (quintiles) and then are tested to determine if the companies in the group with the best attributes (top quintile) outperform the group with the least desirable attributes (bottom quintile).
Figure 9 provides an example. In this example, we start with 20 companies that we refer to as A through T. The first step—the left-hand side of the exhibit—is to order the 20 companies by profitability from highest to lowest. In the second step, this ordered list is divided into five groups, creating a most profitable group (top quintile) down to the least profitable group (bottom quintile). The top and bottom quintile groups are boxed on the right-hand chart of the figure. Finally, the performance of the top quintile is compared to the bottom quintile.
As Figure 9 shows, the stocks with highest profitability (top quintile) returned 2.6% while the stocks with the lowest profitability (bottom quintile) returned only 0.6%. So the top quintile stocks outperformed the bottom quintile stocks by 2.0%, meaning for this month, the most profitable companies outperformed the least profitable companies by 2.0%. This is commonly referred to as the characteristic’s quintile return or quintile spread. The higher the quintile spread, the more attractive the characteristic is.
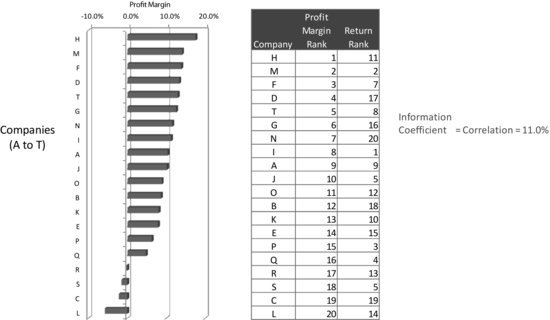
Figure 10 Determining the Characteristic’s Information Coefficient
Information Coefficient
Another common metric used for determining if a characteristic is good at separating the strong- from the weak-performing stocks is the information coefficient (IC). It does so by measuring the correlation between a stock’s characteristic (i.e., profitability) and its return. The major difference between the IC and quintile return is that the IC looks across all of the stocks, while the quintile return only focuses on the best and worst stocks, ignoring those stocks in the middle. The IC is more concerned with differentiating performance across all stocks rather than the extremes.
The calculation of the IC is detailed in Figure 10. Similar to assessing the quintile return, the sort ordering of the companies based on profitability is done first. However, the next step is different. In the second step, each stock is ranked on both profitability and return. The most profitable company is assigned a rank of 1 all the way down to the least profitable company, which is assigned a rank of 20. Likewise for stock returns: The highest returning stock is assigned a rank of 1 down to the lowest returning stock receiving a rank of 20. In the third step, the rank of the company’s profitability is correlated with the rank of the company’s return. The correlation of the two ranks is the IC, which is 11% as shown in Figure 10. The higher the correlation (i.e., IC), the more likely companies with higher profitability also have higher returns and the more effective the characteristic.
When is it better to employ an IC over a quintile spread? IC is a better metric when a quantitative investor is considering owning a greater number of stocks in the portfolio. The reason is that the IC looks at the relationships across all of the stocks in the group. The quintile return is better suited for more concentrated bets in fewer stocks as it places a greater emphasis on measuring the few stocks at the extremes.
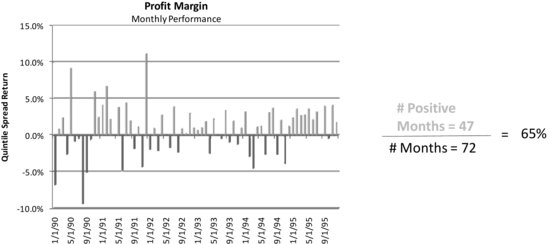
Figure 11 Determining the Characteristic’s Batting Average
The last two examples reviewed how a characteristic (profitability) was able to explain the next month’s return for a group of stocks. In both cases it looked effective—a quintile return of 2.0% and an IC of 11%. However, in practice, it is also necessary to assess whether the characteristic was effective for not only one month, but over decades of investing encompassing multiple market cycles. To that end, during the research process a quantitative investor will look at the average quintile returns or ICs over an extended period of up to 20 years or more. When looking at these longer time series, quantitative investors use additional metrics to understand the characteristic’s effectiveness.
Characteristic Testing: Key Measures of Consistency
Two commonly used measures of consistency are batting average and information ratio.
Batting Average
Batting average is a straightforward metric. In baseball a player’s batting average is the number of hits divided by the number of times at bat. A similar metric is used in investing. Batting average is the number of positive performance months (hits) divided by the number of total months (at bats). The higher the batting average, the more consistently the characteristic generates positive performance.
As Figure 11 displays, to arrive at the batting average we take the number of months the quintile return was positive divided by the number of months tested. In our example, in 47 of the 72 months profitability was effective, resulting in a positive return. This translates to a batting average of 65%, which is quite high. Imagine walking into a casino in Las Vegas where you have a 65% chance of winning every bet. That casino would not be in business very long with you at the table.
Information Ratio
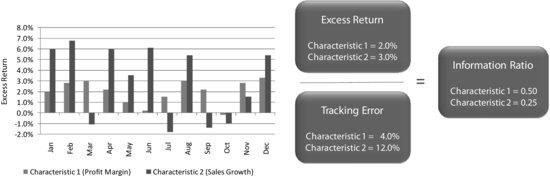
Information ratio is also used to measure consistency. This measure is defined as the average return of a characteristic divided by its volatility—basically a measure of return per unit of risk or risk reward ratio. For volatility, quantitative investors use tracking error, which is the standard deviation of excess returns.
Figure 12 demonstrates the calculation of the information ratio. In this example, there are two characteristics. Which one should be selected? Based only on returns, we would choose characteristic 2 since it has a higher excess return (3.0%) than characteristic 1 (2.0%). However, as we can see in the figure, characteristic 2 also has much larger swings in performance than characteristic 1 and therefore more risk. The higher risk of characteristic 2 is confirmed by its high tracking error of 12.0%, three times greater than characteristic 1’s tracking error of 4.0%. Characteristic 1 looks much better on a risk-adjusted basis with an information ratio of 0.50 (2.0%/4.0%) or twice characteristic 2’s information ratio of 0.25 (3.0%/12.0%). So even though characteristic 1 has a lower return than characteristic 2, it also has much less risk, making it preferred since investors are rewarded more for the risk they are taking.
Figure 12 Determining the Characteristic’s Information Ratio
Model Creation
After reviewing and selecting the best characteristics, the quantitative investor then needs to assemble them into a stock selection model. This step of the research process is called model creation. It usually involves two main components:
Let us begin by discussing the first component in model creation: measuring correlation. When including characteristics in a stock selection model, the quantitative investor does not want to include two characteristics that have very similar performance since they may be measuring similar aspects of the company. In these cases, quantitative managers could be potentially doubling their position in a stock for the same reason. For instance, stocks with a historically high sales growth may perform similarly to stocks with high expected growth in the future, or stocks with strong gross margins may perform similarly to stocks with strong profit margins. In either case, we would not include both similar characteristics.
An example is provided in Figure 13, which shows the cumulative quintile spread return over 10 years for three characteristics (which we have labeled A, B, and C). Characteristic A did the best at differentiating the winners from losers—the stocks it liked outperformed the stocks it did not like by almost 10% over the 10-year period. Characteristic B was next with a return slightly greater than 8%, and characteristic C was the lowest with an almost 4% cumulative 10-year return. Given that all three characteristics have good performance, which two should the quantitative investor retain in the model?
Figure 13 Model Creation: Correlation Review/Table 1 Characteristic Correlations
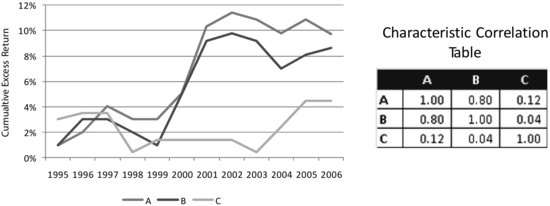
Figure 14 Stock Selection Model: Characteristic Weightings
Although characteristics A and B are better at differentiating winners from losers than characteristic C, A’s return pattern looks very similar to B’s. This is confirmed by Table 1 where characteristics A and B have a correlation of 0.80. Since a correlation of 1.00 means their returns move in lockstep, a correlation of 0.80 indicates they are very similar. Rather than keeping both A and B and potentially doubling our positions from similar characteristics, it would be best to keep either A or B and combine the characteristic retained with C. Even though characteristic C is the worst performing of the three, for the stock selection model C provides a good uncorrelated source of performance.
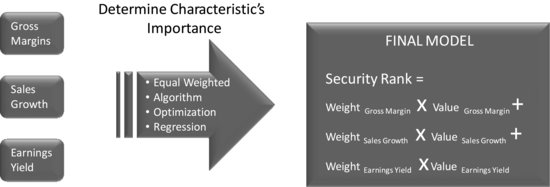
Once the characteristics to select stocks are identified, quantitative investors are ready to determine the importance or weight of each characteristic. They must decide whether all characteristics should have the same weight or whether better characteristics should have greater weight in the stock selection model.
There are many ways to determine the weights of the characteristics. We can simply equal weight them or use some other process such as creating an algorithm, performing regressions, or optimizing. Figure 14 shows how a typical stock selection model is created. In this step, the selected characteristics are combined to determine a target for each stock whether it be a return forecast, rank, or a position size.
Figure 15 Three Main Steps of the Portfolio Construction Phase

Once the combination of characteristics for the model is selected, the quantitative investor determines their weights and then reviews the model. Model review is similar to reviewing a single characteristic. The model is looked at from many perspectives, calculating all of the metrics described in Figure 8. The quantitative investor would look at how the top-quintile stocks of the model perform versus the bottom and look at information coefficients of the stock selection model over time. In addition, how much trading or turnover the stock selection model creates is reviewed or if there are any biases in the stock selections (e.g., too many small-cap stocks, or a reliance on high- or low-beta stocks). In practice, the review is much more extensive, covering many more metrics. If the stock selection model does not hold up under this final review, then the quantitative investor will need to change the stock selection model to eliminate the undesirable effects.
PORTFOLIO CONSTRUCTION
In the second phase of the investment process, the quantitative investor uses the stock selection model to buy stocks. It is in this phase that the quantitative investor puts the model into production. Returning to our golfer analogy, this is when they travel to the course to play a round of golf.
During the portfolio construction phase, the model is ready to create a daily portfolio. This phase consists of three main steps as shown in Figure 15 and described below.
Data Collection
As Figure 16 shows, data come from many different sources, such as a company’s fundamental, pricing, economic, and other data (specialized data sources). All of these data are updated nightly, so it is important to have robust systems and processes established to handle large amounts of data, clean the data (check for errors), and process it in a timely fashion. The quantitative investor seeks to have everything ready to trade at the market opening.
Creating Security Weights
After the data are collected and verified, the next step is running all of the updated company information through the stock selection model. This will create final positions for every stock in the screened universe. In this step, each stock is ranked using the stock selection model, with the better scoring companies making it into the portfolio.
Figure 16 Data Collection Step of the Portfolio Construction Phase
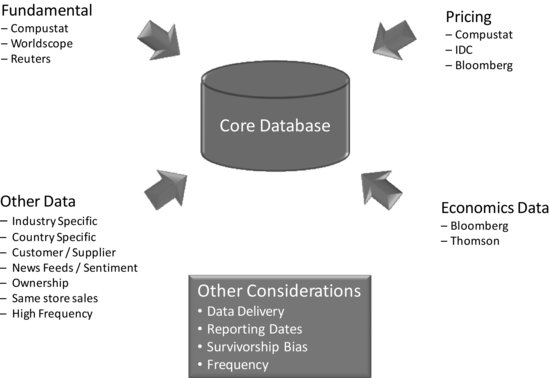
Figure 17 Creating Security Weights Step of the Portfolio Construction Phase
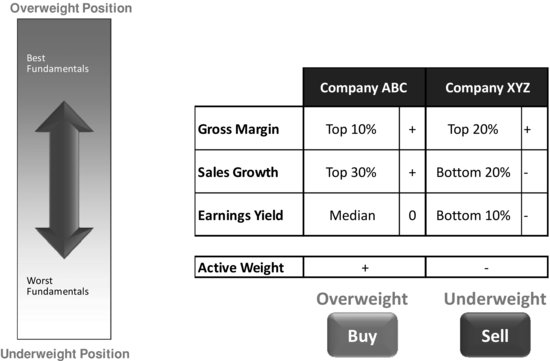
Figure 17 provides a simplified example of this, showing a stock selection model with three characteristics: gross margins, sales growth, and earnings yield (i.e., earnings-to-price ratio; the higher the ratio, the more attractively priced the stock is). From the example, Company ABC is in the top 10% of companies based on gross margin, in the top 30% in sales growth, and average on earnings yield. Company ABC may represent a company finding a profitable market and growing into it, and the rest of the market has not caught on to its prospects, so it is still valued like an average stock. In this case, the stock rates favorably by the stock selection model and would be purchased. The other stock, the stock of Company XYZ, is not as favorable and either would not be held in the portfolio or, if permitted, could be shorted. Although Company XYZ also has good margins, its growth is slowing and it is relatively expensive compared to its earnings. The company could be one that had a profitable niche, but its niche may be shrinking as sales are dwindling. Furthermore, the investment community has not discounted the slowing growth and hence the stock is still expensive.
Trade
The final step in the portfolio construction process is to trade into the new positions chosen by the stock selection model. While many investment approaches trade regularly, even daily, quantitative investors tend not to. Quantitative investors tend to trade monthly or longer. They may wait for the views from their stock selection model to change significantly from their current portfolio before trading into the new views.
MONITORING
The third and final phase in the quantitative equity investment process is monitoring performance and risk. This step is important to check if any hidden biases are embedded in the portfolio and that the portfolio is performing in line with expectations. Returning one last time to our golfer analogy, this is when the golfer is making mental notes as to what is and isn’t working during the round to improve his or her game in the future. This step can be broken into two activities: risk management and performance attribution.
Risk Management
In risk management, the main emphasis is on making sure that the quantitative investor is buying companies consistent with the stock selection model. Returning to the retail model discussed earlier in this entry, the model liked companies with good profit margins but had no view on the company’s beta. So the quantitative investor would want to make sure that the companies included in the portfolio have high profit margins but average beta. If the portfolio started to include high-beta stocks, the quantitative investor would want to make adjustments to the process to eliminate this high-beta bias. There are many types of risk management software and techniques that can be used to detect any hidden risks embedded in the portfolio and provide ways to remedy those identified.
Another aspect of risk management is to make sure that the portfolio’s risk level is consistent with the modeling phase. The quantitative investor wants to ensure that the tracking error is not too high or low relative to expectations. Again, risk management techniques and software can be used to monitor tracking error and sources of tracking error, and to remedy any deviations from expectations.
Performance Attribution
Performance attribution is critical in ensuring that the actual live portfolio’s performance is coming from the characteristics in the stock selection model and is in line with performance expected during the modeling stage. Performance attribution is like monitoring a car’s gas mileage: If the gas mileage begins to dip below what the driver expects, or what it is known to be, then the driver would want to look under the car’s hood. Similarly, if the stock selection model is not producing the desired results, or the results have changed, then the quantitative investor would need to look under the hood of the stock selection model. If performance is not being generated from the selected characteristics, then the quantitative manager would want to check out the model in more detail. One possibility is that another characteristic is canceling the desired characteristics, or the model should be providing more weight to the desired characteristic.
The monitoring phase is critical in making sure that the stock selection model is being implemented as expected.
CURRENT TRENDS
Let’s look at some recent trends in the quantitative investment industry.
Many quantitative equity investors are looking for additional sources of alpha by using alternative data sources to help select stocks. One notable source is industry-specific data (e.g., banking, airlines, and retail). Additionally, quantitative investors are turning to the Internet to better understand news flows for companies through Web-based search engines. Furthermore, quantitative investors are using more conditioning models. Conditioning occurs when two characteristics are combined rather than choosing them side by side in a stock selection model. Traditional models would look for companies that have either attractive margins or growth. With conditioning models, companies that have both attractive margins and growth are sought.
Dynamic modeling is gaining renewed popularity. It consists of timing characteristics, determining when they should enter or leave a stock selection model based on business cycle analysis, technical market indicators, or other information. For instance, during recessionary periods, a quantitative investor may want companies with strong profitability, while in expansionary periods companies with good growth prospects are sought. A stock selection model would contain profitability when the economy is entering a recession, and then include the growth characteristic once it felt that the economy is moving into an expansionary period. This is an example of how quantitative investors are bringing more personal judgment to the process, similar to fundamental investors.
Finally, with the advent of high-frequency trading and more advanced trading analytics, many quantitative investors are reviewing how best to implement their stock selection models. Some characteristics such as earnings surprise may have short-lived alpha prospects, so quantitative investors would want to trade into these stocks more quickly. Other characteristics are longer term in nature, such as valuation metrics, so investors would not have to trade into companies with attractive valuations as quickly. Furthermore, trading costs are being measured with greater granularity, allowing quantitative investors to measure transaction cost and incorporate these better estimates into their research modeling phase.
KEY POINTS
- Investing begins with processing many different types of information to find the most attractively priced assets. Fundamental and quantitative investors differ in their approach to the available information. The fundamental investor’s primary focus is on a single company at a time, while the quantitative investor’s primary focus is on a single characteristic at a time.
- Quantitative and fundamental approaches are complementary. By combining the two approaches you can obtain a more well-rounded investment process including breadth and depth in analysis, facts based on human judgment, a past and future perspective of a company, and a more well-rounded view of risk and performance of the portfolio.
- The quantitative equity investment process is made up of three phases: research, portfolio construction, and monitoring. During the research phase, the stock selection model is created. During the portfolio construction phase, the quantitative investor “productionalizes” the stock selection model or gets it ready to invest in a live portfolio. Finally, during the monitoring phase, the quantitative investor makes sure the portfolio is performing as expected.
- At the heart of the quantitative equity investment process is the stock selection model. The model includes those characteristics that are best at delineating the highest from lowest returning stocks. Models can be created for industries, sectors, or styles.
- Two common metrics used to judge a characteristic’s effectiveness are quintile returns and information coefficients. Two more metrics used to understand the consistency of a characteristic’s performance over time are batting average and information ratio.
- During the portfolio construction phase, data are collected from multiple sources and run through the investor’s stock selection model to arrive at a list of buy and sell candidates. The buy candidates will have the strongest characteristic values in the investor’s stock selection model, and the sell candidates the weakest characteristic values.
- The monitoring phase is when the investor assures that the performance in the portfolio is consistent with expectations. During this phase, the investor will make sure there are no hidden bets in the portfolio and that the characteristics in the stock selection model are performing as expected.
NOTES
1. Throughout the entry we discuss whether characteristics can separate a stock with strong future returns from one with weak future returns. Many times reference will be made to a “strong” characteristic that can differentiate the strong- from weak-performing stocks.
2. In this entry, the term “characteristic” means the attributes that differentiate companies. Quantitative investors often refer to these same characteristics as factors or signals which they typically use in their stock selection model.