
Cash-Flow Analysis
One of the key financial measures that an analyst should understand is the company’s cash flow. This is because the cash flow aids the analyst in assessing the ability of the company to satisfy its contractual obligations and maintain current dividends and current capital expenditure policy without relying on external financing. Moreover, an analyst must understand why this measure is important for external parties, specifically stock analysts covering the company. The reason is that the basic valuation principle followed by stock analysts is that the value of a company today is the present value of its expected future cash flows. In this entry, we discuss cash-flow analysis.
DIFFICULTIES WITH MEASURING CASH FLOW
The primary difficulty with measuring a cash flow is that it is a flow: Cash flows into the company (cash inflows) and cash flows out of the company (cash outflows). At any point in time there is a stock of cash on hand, but the stock of cash on hand varies among companies because of the size of the company, the cash demands of the business, and a company’s management of working capital. So what is cash flow? Is it the total amount of cash flowing into the company during a period? Is it the total amount of cash flowing out of the company during a period? Is it the net of the cash inflows and outflows for a period? Well, there is no specific definition of cash flow—and that’s probably why there is so much confusion regarding the measurement of cash flow. Ideally, a measure of the company’s operating performance that is comparable among companies is needed—something other than net income.
A simple, yet crude method of calculating cash flow requires simply adding noncash expenses (e.g., depreciation and amortization) to the reported net income amount to arrive at cash flow. For example, the estimated cash flow for Procter & Gamble (P&G) for 2002 is:
Estimated cash flow
This amount is not really a cash flow, but simply earnings before depreciation and amortization. Is this a cash flow that stock analysts should use in valuing a company? Though not a cash flow, this estimated cash flow does allow a quick comparison of income across firms that may use different depreciation methods and depreciable lives. (As an example of the use of this estimate of cash flow, The Value Line Investment Survey, published by Value Line, Inc., reports a cash flow per share amount, calculated as reported earnings plus depreciation, minus any preferred dividends, stated per share of common stock.) [Guide to Using the Value Line Investment Survey (New York: Value Line, Inc.), p. 19.]
The problem with this measure is that it ignores the many other sources and uses of cash during the period. Consider the sale of goods for credit. This transaction generates sales for the period. Sales and the accompanying cost of goods sold are reflected in the period’s net income and the estimated cash flow amount. However, until the account receivable is collected, there is no cash from this transaction. If collection does not occur until the next period, there is a misalignment of the income and cash flow arising from this transaction. Therefore, the simple estimated cash flow ignores some cash flows that, for many companies, are significant.
Another estimate of cash flow that is simple to calculate is earnings before interest, taxes, depreciation, and amortization (EBITDA). However, this measure suffers from the same accrual-accounting bias as the previous measure, which may result in the omission of significant cash flows. Additionally, EBITDA does not consider interest and taxes, which may also be substantial cash outflows for some companies. (For a more detailed discussion of the EBITDA measure, see Eastman [1997].)
These two rough estimates of cash flows are used in practice not only for their simplicity, but because they experienced widespread use prior to the disclosure of more detailed information in the statement of cash flows. Currently, the measures of cash flow are wide ranging, including the simplistic cash flow measures, measures developed from the statement of cash flows, and measures that seek to capture the theoretical concept of free cash flow.
CASH FLOWS AND THE STATEMENT OF CASH FLOWS
Prior to the adoption of the statement of cash flows, the information regarding cash flows was quite limited. The first statement that addressed the issue of cash flows was the statement of financial position, which was required starting in 1971 (APB Opinion No. 19, “Reporting Changes in Financial Position”). This statement was quite limited, requiring an analysis of the sources and uses of funds in a variety of formats. In its earlier years of adoption, most companies provided this information using what is referred to as the working capital concept—a presentation of working capital provided and applied during the period. Over time, many companies began presenting this information using the cash concept, which is a most detailed presentation of the cash flows provided by operations, investing, and financing activities.
Consistent with the cash concept format of the funds flow statement, the statement of cash flows is now a required financial statement. The requirement that companies provide a statement of cash flows applies to fiscal years after 1987 (Statement of Financial Accounting Standards No. 95, “Statement of Cash Flows”). This statement requires the company to classify cash flows into three categories, based on the activity: operating, investing, and financing. Cash flows are summarized by activity and within activity by type (e.g., asset dispositions are reported separately from asset acquisitions).
The reporting company may report the cash flows from operating activities on the statement of cash flows using either the direct method—reporting all cash inflows and outflows—or the indirect method—starting with net income and making adjustments for depreciation and other noncash expenses and for changes in working capital accounts. Though the direct method is recommended, it is also the most burdensome for the reporting company to prepare. Most companies report cash flows from operations using the indirect method. The indirect method has the advantage of providing the financial statement user with a reconciliation of the company’s net income with the change in cash. The indirect method produces a cash flow from operations that is similar to the estimated cash flow measure discussed previously, yet it encompasses the changes in working capital accounts that the simple measure does not. For example, Procter & Gamble’s cash flow from operating activities (taken from their 2002 statement of cash flows) is $7,742 million, which is over $1 billion more than the cash flow that we estimated earlier. (Procter & Gamble’s fiscal year ends June 30, 2002.)
The classification of cash flows into the three types of activities provides useful information that can be used by an analyst to see, for example, whether the company is generating sufficient cash flows from operations to sustain its current rate of growth. However, the classification of particular items is not necessarily as useful as it could be. Consider some of the classifications:
- Cash flows related to interest expense are classified in operations, though they are clearly financing cash flows.
- Income taxes are classified as operating cash flows, though taxes are affected by financing (e.g., deduction for interest expense paid on debt) and investment activities (e.g., the reduction of taxes from tax credits on investment activities).
- Interest income and dividends received are classified as operating cash flows, though these flows are a result of investment activities.
Whether these items have a significant effect on the analysis depends on the particular company’s situation. Procter & Gamble, for example, has very little interest and dividend income, and its interest expense of $603 million is not large relative to its earnings before interest and taxes ($6,986 million). Table 1 shows that by adjusting P&G’s cash flows for the interest expense only (and related taxes) changes the complexion of its cash flows slightly to reflect greater cash-flow generation from operations and less cash flow reliance on financing activities.
Table 1 Adjusted Cash Flow for P&G (2002)
Source: Procter & Gamble 2002 Annual Report.
| As | As | |
| (In Millions) | Reported | Adjusted |
| Cash flow from operations | $7,741 | $8,134 |
| Cash flow for investing activities | (6,835) | (6,835) |
| Cash flow from (for) financing activities | 197 | (195) |
Table 2 Adjusted Cash Flow, Amazon.com (2001)
Source: Amazon.com 2001 10-K.
| As | As | |
| (In Millions) | Reported | Adjusted |
| Cash flow from operations | $(120) | $(30) |
| Cash flow for investing activities | (253) | (253) |
| Cash flow from financing activities | (107) | 17 |
| The adjustment is based on interest expense of $139 million, and a tax rate of 35%. | ||
The adjustment is for $603 million of interest and other financing costs, less its tax shield (the amount that the tax bill is reduced by the interest deduction) of $211 (estimated from the average tax rate of 35% of $603): adjustment = $603 (1 – 0.35) = $392.
For other companies, however, this adjustment may provide a less flattering view of cash flows. Consider Amazon.com’s fiscal year results. Interest expense to financing, along with their respective estimated tax effects, results in more reliance on cash flow from financing as can be seen in Table 2.
Looking at the relation among the three cash flows in the statement provides a sense of the activities of the company. A young, fast-growing company may have negative cash flows from operations, yet positive cash flows from financing activities (that is, operations may be financed in large part with external financing). As a company grows, it may rely to a lesser extent on external financing. The typical, mature company generates cash from operations and reinvests part or all of it back into the company. Therefore, cash flow related to operations is positive (that is a source of cash) and cash flow related to investing activities is negative (that is, a use of cash). As a company matures, it may seek less financing externally and may even use cash to reduce its reliance on external financing (e.g., repay debts). We can classify companies on the basis of the pattern of their sources of cash flows, as shown in Table 3. Though additional information is required to assess a company’s financial performance and condition, examination of the sources of cash flows, especially over time, gives us a general idea of the company’s operations. P&G’s cash flow pattern is consistent with that of a mature company, whereas Amazon.com’s cash flows are consistent with those of a fast-growing company that is reliant on outside funds for growth.
Table 3 Patterns of Sources of Cash Flows
Fridson (2002) suggests reformatting the statement of cash flows as shown in Table 4. From the basic cash flow, the nondiscretionary cash needs are subtracted resulting in a cash flow referred to as discretionary cash flow. By restructuring the statement of cash flows in this way, it can be seen how much flexibility the company has when it must make business decisions that may adversely impact the long-run financial health of the enterprise.
For example, consider a company with a basic cash flow of $800 million and operating cash flow of $500 million. Suppose that this company pays dividends of $130 million and that its capital expenditure is $300 million. Then the discretionary cash flow for this company is $200 million found by subtracting the $300 million capital expenditure from the operating cash flow of $500 million. This means that even after maintaining a dividend payment of $130 million, its cash flow is positive. Notice that asset sales and other investing activity are not needed to generate cash to meet the dividend payments because in Table 4 these items are subtracted after accounting for the dividend payments. In fact, if this company planned to increase its capital expenditures, the format in Table 4 can be used to assess how much that expansion can be before affecting dividends and/or increasing financing needs.
Though we can classify a company based on the sources and uses of cash flows, more data are needed to put this information in perspective. What is the trend in the sources and uses of cash flows? What market, industry, or company-specific events affect the company’s cash flows? How does the company being analyzed compare with other companies in the same industry in terms of the sources and uses of funds?
Table 4 Suggested Reformatting of Cash Flow Statement to Analyze a Company’s Flexibility
Source: This format was suggested by Fridson (1995).
| Basic cash flow | |
| Less: | Increase in adjusted working capital |
| Operating cash flow | |
| Less: | Capital expenditures |
| Discretionary cash flow | |
| Less: | Dividends |
| Less: | Asset sales and other investing activities |
| Cash flow before financing | |
| Less: | Net (increase) in long-term debt |
| Less: | Net (increase) in notes payable |
| Less: | Net purchase of company’s common stock |
| Less: | Miscellaneous |
| Cash flow | |
| Notes:
1. The basic cash flow includes net earnings, depreciation, and deferred income taxes, less items in net income not providing cash. 2. The increase in adjusted working capital excludes cash and payables. |
|
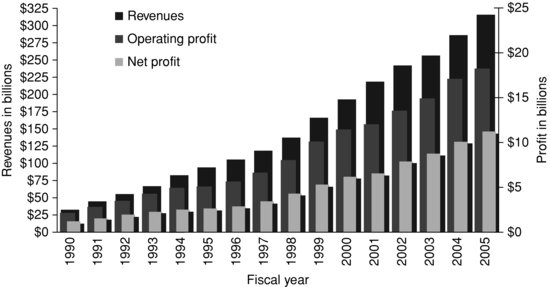
Let’s take a closer look at the incremental information provided by cash flows. Consider Wal-Mart Stores, Inc., which had growing sales and net income from 1990 to 2005, as summarized in Figure 1. We see that net income grew each year, with the exception of 1995, and that sales grew each year.
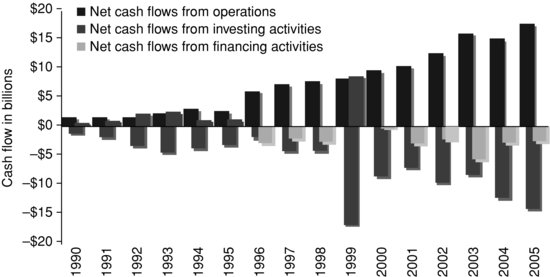
We get additional information by looking at the cash flows and their sources, as graphed in Figure 2. We see that the growth in Wal-Mart was supported both by internally generated funds and, to a lesser extent, through external financing. Wal-Mart’s pattern of cash flows suggests that Wal-Mart is a mature company that has become less reliant on external financing, funding most of its growth in recent years (with the exception of 1999) with internally generated funds.
Figure 1 Wal-Mart Stores, Inc., Revenues, Operating Profit, and Net Income, 1990–2005
Source: Wal-Mart Stores, Inc., Annual Report, various years.
FREE CASH FLOW
Cash flows without any adjustment may be misleading because they do not reflect the cash outflows that are necessary for the future existence of a firm. An alternative measure, free cash flow, was developed by Jensen (1986) in his theoretical analysis of agency costs and corporate takeovers. In theory, free cash flow is the cash flow left over after the company funds all positive net present value projects. Positive net present value projects are those capital investment projects for which the present value of expected future cash flows exceeds the present value of project outlays, all discounted at the cost of capital. (The cost of capital is the cost to the company of funds from creditors and shareholders. The cost of capital is basically a hurdle: If a project returns more than its cost of capital, it is a profitable project.) In other words, free cash flow is the cash flow of the firm, less capital expenditures necessary to stay in business (that is, replacing facilities as necessary) and grow at the expected rate (which requires increases in working capital).
Figure 2 Wal-Mart Stores, Inc., Cash Flows, 1990–2005
Source: Wal-Mart Stores, Inc., Annual Report, various years.
The theory of free cash flow was developed by Jensen to explain behaviors of companies that could not be explained by existing economic theories. Jensen observed that companies that generate free cash flow should disgorge that cash rather than invest the funds in less profitable investments. There are many ways in which companies can disgorge this excess cash flow, including the payment of cash dividends, the repurchase of stock, and debt issuance in exchange for stock. The debt-for-stock exchange, for example, increases the company’s leverage and future debt obligations, obligating the future use of excess cash flow. If a company does not disgorge this free cash flow, there is the possibility that another company—a company whose cash flows are less than its profitable investment opportunities or a company that is willing to purchase and lever-up the company—will attempt to acquire the free-cash-flow-laden company.
As a case in point, Jensen observed that the oil industry illustrates the case of wasting resources: The free cash flows generated in the 1980s were spent on low-return exploration and development and on poor diversification attempts through acquisitions. He argues that these companies would have been better off paying these excess cash flows to shareholders through share repurchases or exchanges with debt.
By itself, the fact that a company generates free cash flow is neither good nor bad. What the company does with this free cash flow is what is important. And this is where it is important to measure the free cash flow as that cash flow in excess of profitable investment opportunities. Consider the simple numerical exercise with the Winner Company and the Loser Company:
| Winner | Loser | |
| Company | Company | |
| Cash flow before capital expenditures | $1,000 | $1,000 |
| Capital expenditures, positive net present value projects | (750) | (250) |
| Capital expenditures, negative net present value projects | 0 | (500) |
| Cash flow | $250 | $250 |
| Free cash flow | $250 | $750 |
These two companies have identical cash flows and the same total capital expenditures. However, the Winner Company spends only on profitable projects (in terms of positive net present value projects), whereas the Loser Company spends on both profitable projects and wasteful projects. The Winner Company has a lower free cash flow than the Loser Company, indicating that they are using the generated cash flows in a more profitable manner. The lesson is that the existence of a high level of free cash flow is not necessarily good—it may simply suggest that the company is either a very good takeover target or the company has the potential for investing in unprofitable investments.
Positive free cash flow may be good or bad news; likewise, negative free cash flow may be good or bad news:
| Good News | Bad News | |
| Positive free cash flow | The company is generating substantial operating cash flows, beyond those necessary for profitable projects. | The company is generating more cash flows than it needs for profitable projects and may waste these cash flows on unprofitable projects. |
| Negative free cash flow | The company has more profitable projects than it has operating cash flows and must rely on external financing to fund these projects. | The company is unable to generate sufficient operating cash flows to satisfy its investment needs for future growth. |
Therefore, once the free cash flow is calculated, other information (e.g., trends in profitability) must be considered to evaluate the operating performance and financial condition of the firm.
CALCULATING FREE CASH FLOW
There is some confusion when this theoretical concept is applied to actual companies. The primary difficulty is that the amount of capital expenditures necessary to maintain the business at its current rate of growth is generally not known; companies do not report this item and may not even be able to determine how much of a period’s capital expenditures are attributed to maintenance and how much are attributed to expansion.
Consider Procter & Gamble’s property, plant, and equipment for 2002, which comprise some, but not all, of P&G’s capital investment:
| Additions to property, plant, and equipment | $1,679 million |
| Dispositions of property, plant, and equipment | (227) |
| Net change before depreciation | $1,452 million |
(In addition to the traditional capital expenditures (that is, changes in property, plant, and equipment), P&G also has cash flows related to investment securities and acquisitions. These investments are long-term and are hence part of P&G’s investment activities cash outflow of $6,835 million.)
How much of the $1,679 million is for maintaining P&G’s current rate of growth and how much is for expansion? Though there is a positive net change of $1,452 million, does it mean that P&G is expanding? Not necessarily: The additions are at current costs, whereas the dispositions are at historical costs. The additions of $1,679 are less than P&G’s depreciation and amortization expense for 2001 of $1,693 million, yet it is not disclosed in the financial reports how much of this latter amount reflects amortization. (P&G’s depreciation and amortization are reported together as $1,693 million on the statement of cash flows.) The amount of necessary capital expenditures is therefore elusive.
Some estimate free cash flow by assuming that all capital expenditures are necessary for the maintenance of the current growth of the company. Though there is little justification in using all expenditures, this is a practical solution to an impractical calculation. This assumption allows us to estimate free cash flows using published financial statements.
Another issue in the calculation is defining what is truly “free” cash flow. Generally, we think of “free” cash flow as that being left over after all necessary financing expenditures are paid; this means that free cash flow is after interest on debt is paid. Some calculate free cash flow before such financing expenditures, others calculate free cash flow after interest, and still others calculate free cash flow after both interest and dividends (assuming that dividends are a commitment, though not a legal commitment).
There is no one correct method of calculating free cash flow and different analysts may arrive at different estimates of free cash flow for a company. The problem is that it is impossible to measure free cash flow as dictated by the theory, so many methods have arisen to calculate this cash flow. A simple method is to start with the cash flow from operations and then deduct capital expenditures. For P&G in 2002,
| Cash flow from operations | $7,742 |
| Deduct capital expenditures | (1,692) |
| Free cash flow | $6,050 |
Though this approach is rather simple, the cash flow from the operations amount includes a deduction for interest and other financing expenses. Making an adjustment for the after-tax interest and financing expenses, as we did earlier for Procter & Gamble,
| Cash flow from operations (as reported) | $7,742 |
| Adjustment | 392 |
| Cash flow from operations (as adjusted) | $8,134 |
| Deduct capital expenditures | (1,692) |
| Free cash flow | $6,442 |
We can relate free cash flow directly to a company’s income. Starting with net income, we can estimate free cash flow using four steps:
Using these four steps, we can calculate the free cash flow for Procter & Gamble for 2002, as shown in Table 5.
Table 5 Calculation of Procter & Gamble’s Free Cash Flow for 2002, in Millions*
| Step l: | ||
| Net income | $4,352 | |
| Add taxes | 2,031 | |
| Add interest | 603 | |
| Earnings before interest and taxes | $6,986 | |
| Step 2: | ||
| Earnings before interest and taxes | $6,986 | |
| Deduct taxes (@35%) | (2.445) | |
| Earnings before interest | $4,541 | |
| Step 3: | ||
| Earnings before interest | $4,541 | |
| Add depreciation and amortization | 1,693 | |
| Add increase in deferred taxes | 389 | |
| Earnings before noncash expenses | $6,623 | |
| Step 4: | ||
| Earnings before noncash expenses | $6,623 | |
| Deduct capital expenditures | (1,679) | |
| Add decrease in receivables | $96 | |
| Add decrease in inventories | 159 | |
| Add cash flows from changes in accounts payable, accrued expenses, and other liabilities | 684 | |
| Deduct cash flow from changes in other operating assets and liabilities | (98) | |
| Cash flow from change in working capital accounts | 841 | |
| Free cash flow | $5,785 | |
| *Procter & Gamble’s fiscal year ended June 30, 2002. Charges in operating accounts are taken from Procter & Gamble’s Statement of Cash Flows. | ||
NET FREE CASH FLOW
There are many variations in the calculation of cash flows that are used in analyses of companies’ financial condition and operating performance. As an example of these variations, consider the alternative to free cash flow developed by Fitch, a company that rates corporate debt instruments. This cash flow measure, referred to as net free cash flow (NFCF), is free cash flow less interest and other financing costs and taxes. In this approach, free cash flow is defined as earnings before depreciation, interest, and taxes, less capital expenditures. Capital expenditures encompass all capital spending, whether for maintenance or expansion, and no changes in working capital are considered.
The basic difference between NFCF and free cash flow is that the financing expenses— interest and, in some cases, dividends—are deducted. If preferred dividends are perceived as nondiscretionary—that is, investors come to expect the dividends—dividends may be included with the interest commitment to arrive at net free cash flow. Otherwise, dividends are deducted from net free cash flow to produce cash flow. Another difference is that NFCF does not consider changes in working capital in the analysis.
Further, cash taxes are deducted to arrive at net free cash flow. Cash taxes are the income tax expense restated to reflect the actual cash flow related to this obligation, rather than the accrued expense for the period. Cash taxes are the income tax expense (from the income statement) adjusted for the change in deferred income taxes (from the balance sheets). For Procter & Gamble in 2002,
| Income tax expense | $2,031 |
| Deduct increase in deferred income tax | (389) |
| Cash taxes | $1,642 |
(Note that cash taxes require taking the tax expense and either increasing this to reflect any decrease in deferred taxes [that is, the payment this period of tax expense recorded in a prior period] or decreasing this amount to reflect any increase in deferred taxes [that is, the deferment of some of the tax expense].)
In the case of Procter & Gamble for 2002,
| EBIT | $6,986 |
| Add depreciation and amortization | 1,693 |
| EBITDA | $8,679 |
| Deduct capital expenditures | (1,679) |
| Free cash flow | $7,000 |
| Deduct interest | (603) |
| Deduct cash taxes | (1,642) |
| Net free cash flow | $4,755 |
| Deduct cash common dividends | (2,095) |
| Net cash flow | $2,660 |
The free cash flow amount per this calculation differs from the $5,785 that we calculated earlier for two reasons: Changes in working capital and the deduction of taxes on operating earnings were not considered.
Net cash flow gives an idea of the unconstrained cash flow of the company. This cash flow measure may be useful from a creditor’s perspective in terms of evaluating the company’s ability to fund additional debt. From a shareholder’s perspective, net cash flow (that is, net free cash flow net of dividends) may be an appropriate measure because this represents the cash flow that is reinvested in the company.
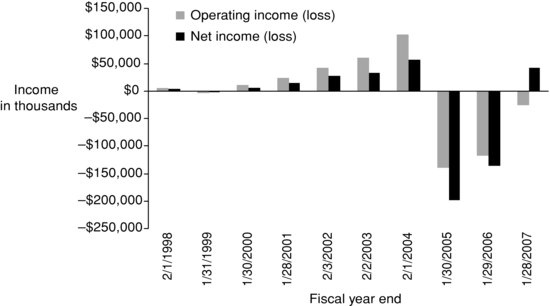
Figure 3 Krispy, Kreme Doughnuts, Inc. Income, 1997–2006
Source: Krispy Kreme Doughnuts, Inc., 10-K filings, various years.
USEFULNESS OF CASH FLOWS IN FINANCIAL ANALYSIS
The usefulness of cash flows for financial analysis depends on whether cash flows provide unique information or provide information in a manner that is more accessible or convenient for the analyst. The cash flow information provided in the statement of cash flows, for example, is not necessarily unique because most, if not all, of the information is available through analysis of the balance sheet and income statement. What the statement does provide is a classification scheme that presents information in a manner that is easier to use and, perhaps, more illustrative of the company’s financial position.
An analysis of cash flows and the sources of cash flows can reveal the following information:
- The sources of financing the company’s capital spending. Does the company generate internally (that is, from operations) a portion or all of the funds needed for its investment activities? If a company cannot generate cash flow from operations, this may indicate problems up ahead. Reliance on external financing (e.g., equity or debt issuance) may indicate a company’s inability to sustain itself over time.
- The company’s dependence on borrowing. Does the company rely heavily on borrowing that may result in difficulty in satisfying future debt service?
- The quality of earnings. Large and growing differences between income and cash flows suggest a low quality of earnings.
Consider the financial results of Krispy Kreme Doughnuts, Inc., a wholesaler and retailer of donuts. Krispy Kreme grew from having fewer than 200 stores before its initial public offering (IPO) in 2000 to over 400 stores at the end of its 2005 fiscal year. Accompanying this growth in stores is the growth in operating and net income, as we show in Figure 3. The growth in income continued after the IPO as the number of stores increased, but the tide in income turned in the 2004 fiscal year and losses continued into the 2005 fiscal year as well.
Figure 4 Krispy, Kreme Doughnuts, Inc., Cash Flows, 1997–2006
Source: Krispy, Kreme Doughnuts, Inc., 10-K filings, various years.

Krispy Kreme’s growth just after its IPO was financed by both operating activities and external financing, as we show in Figure 4. However, approximately half of the funds to support its rapid growth and to purchase some of its franchised stores in the 2000–2003 fiscal years came from long-term financing. This resulted in problems as the company’s debt burden became almost three times its equity as revenue growth slowed by the 2005 fiscal year. Krispy Kreme demonstrated some ability to turn itself around in the 2006 fiscal year, partly by slowing its expansion through new stores.
Ratio Analysis
One use of cash-flow information is in ratio analysis, primarily with the balance sheet and income statement information. Once such ratio is the cash flow–based ratio, the cash-flow interest coverage ratio, which is a measure of financial risk. There are a number of other cash flow–based ratios that an analyst may find useful in evaluating the operating performance and financial condition of a company.
A useful ratio to help further assess a company’s cash flow is the cash flow-to-capital expenditures ratio, or capital expenditures coverage ratio:
The cash-flow measure in the numerator should be one that has not already removed capital expenditures; for example, including free cash flow in the numerator would be inappropriate.
This ratio provides information about the financial flexibility of the company and is particularly useful for capital-intensive firms and utilities (see Fridson, 2002, p. 173). The larger the ratio, the greater the financial flexibility. However, one must carefully examine the reasons why this ratio may be changing over time and why it might be out of line with comparable firms in the industry. For example, a declining ratio can be interpreted in two ways. First, the firm may eventually have difficulty adding to capacity via capital expenditures without the need to borrow funds. The second interpretation is that the firm may have gone through a period of major capital expansion and therefore it will take time for revenues to be generated that will increase the cash flow from operations to bring the ratio to some normal long-run level.
Another useful cash flow ratio is the cash flow-to-debt ratio:
![]()
where debt can be represented as total debt, long-term debt, or a debt measure that captures a specific range of maturity (e.g., debt maturing in five years). This ratio gives a measure of a company’s ability to meet maturing debt obligations. A more specific formulation of this ratio is Fitch’s CFAR ratio, which compares a company’s three-year average net free cash flow to its maturing debt over the next five years (see McConville, 1996). By comparing the company’s average net free cash flow to the expected obligations in the near term (that is, five years), this ratio provides information on the company’s credit quality.
Using Cash-Flow Information
The analysis of cash flows provides information that can be used along with other financial data to help assess the financial condition of a company. Consider the cash flow-to-debt ratio calculated using three different measures of cash flow—EBITDA, free cash flow, and cash flow from operations (from the statement of cash flows)—each compared with long-term debt, as shown in Figure 5 for Weirton Steel.
Figure 5 Cash Flow to Debt Using Alternative Estimates of Cash Flow for Weirton Steel, 1988–1996
Source: Weirton Steel’s 10-K reports, various years.
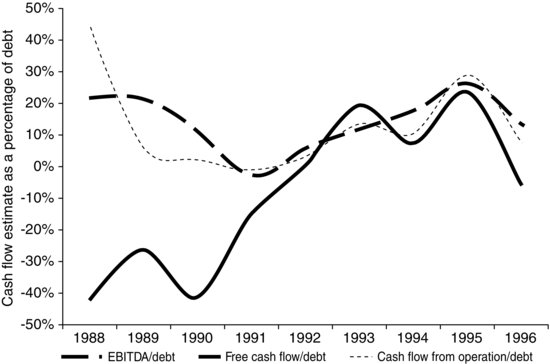
This example illustrates the need to understand the differences among the cash flow measures. The effect of capital expenditures in the 1988–1991 period can be seen by the difference between the free-cash-flow measure and the other two measures of cash flow; both EBITDA and cash flow from operations ignore capital expenditures, which were substantial outflows for this company in the earlier period.
Cash-flow information may help a stock or bond analyst identify companies that may encounter financial difficulties. Consider the study by Largay and Stickney (1980) that analyzed the financial statements of W. T. Grant during the 1966–1974 period preceding its bankruptcy in 1975 and ultimate liquidation. They noted that financial indicators such as profitability ratios, turnover ratios, and liquidity ratios showed some downtrends, but provided no definite clues to the company’s impending bankruptcy. A study of cash flows from operations, however, revealed that company operations were causing an increasing drain on cash, rather than providing cash. (For the period investigated, a statement of changes of financial position [on a working capital basis]) was required to be reported prior to 1988.] This necessitated an increased use of external financing, the required interest payments on which exacerbated the cash-flow drain. Cash-flow analysis clearly was a valuable tool in this case since W. T. Grant had been running a negative cash flow from operations for years. Yet none of the traditional ratios discussed above take into account the cash flow from operations. Use of the cash flow-to-capital expenditures ratio and the cash flow-to-debt ratio would have highlighted the company’s difficulties.
Dugan and Samson (1996) examined the use of operating cash flow as an early warning signal of a company’s potential financial problems. The subject of the study was Allied Products Corporation because for a decade this company exhibited a significant divergence between cash flow from operations and net income. For parts of the period, net income was positive while cash flow from operations was a large negative value. In contrast to W. T. Grant, which went into bankruptcy, the auditor’s report in the 1991 Annual Report of Allied Products Corporation did issue a going-concern warning. Moreover, the stock traded in the range of $2 to $3 per share. There was then a turnaround of the company by 1995. In its 1995 annual report, net income increased dramatically from prior periods (to $34 million) and there was a positive cash flow from operations ($29 million). The stock traded in the $25 range by the spring of 1996. As with the W. T. Grant study, Dugan and Samson (1996) found that the economic realities of a firm are better reflected in its cash flow from operations.
The importance of cash-flow analysis in bankruptcy prediction is supported by the study by Foster and Ward (1997), who compared trends in the statement of cash flows components—cash flow from operations, cash flow for investment, and cash flow for financing—between healthy companies and companies that subsequently sought bankruptcy. They observe that healthy companies tend to have relatively stable relations among the cash flows for the three sources, correcting any given year’s deviation from their norm within one year. They also observe that unhealthy companies exhibit declining cash flows from operations and financing and declining cash flows for investment one and two years prior to the bankruptcy. Further, unhealthy companies tend to expend more cash flows to financing sources than they bring in during the year prior to bankruptcy. These studies illustrate the importance of examining cash flow information in assessing the financial condition of a company.
KEY POINTS
- The term “cash flow” has many meanings and the challenge is to determine the cash-flow definition and calculation that is appropriate. The simplest calculation of cash flow is the sum of net income and noncash expenses. This measure, however, does not consider other sources and uses of cash during the period.
- The statement of cash flows provides a useful breakdown of the sources of cash flows: operating activities, investing activities, and financing activities. Though attention is generally focused on the cash flows from operations, what the company does with the cash flows (that is, investing or paying off financing obligations) and what the sources of invested funds are (that is, operations versus external financing) must be investigated. Minor adjustments can be made to the items classified in the statement of cash flows to improve the classification.
- Examination of the different patterns of cash flows is necessary to get a general idea of the activities of the company. For example, a company whose only source of cash flow is from investing activities, suggesting the sale of property or equipment, may be experiencing financial distress.
- Free cash flow is a company’s cash flow that remains after making capital investments that maintain the company’s current rate of growth. It is not possible to calculate free cash flow precisely, resulting in many different variations in calculations of this measure. A company that generates free cash flow is not necessarily performing well or poorly; the existence of free cash flow must be taken in context with other financial data and information on the company.
- One of the variations in the calculation of a cash-flow measure is net free cash flow, which is, essentially, free cash flow less any financing obligations. This is a measure of the funds available to service additional obligations to suppliers of capital.
REFERENCES
Bernstein, L. A. (1999). Analysis of Financial Statements. 5th edition. New York: McGraw Hill.
Dugan, M. T., and Samson, W. D. (1996). Operating cash flow: Early indicators of financial difficulty and recovery. Journal of Financial Statement Analysis, Summer: 41–50.
Eastman, K. (1997). EBITDA: An overrated tool for cash flow analysis. Commercial Lending Review, January-February: 64–69.
Fabozzi, F. J., Drake, P. P., and Polimeni, R. S. (2007). The Complete CFO Handbook: From Accounting to Accountability. Hoboken, NJ: John Wiley & Sons.
Fridson, M. (2002). Financial Statement Analysis: A Practitioner’s Guide, 3rd edition. New York: John Wiley & Sons.
Jensen, M. C. (1986). Agency costs of free cash flow, corporate finance, and takeovers. American Economic Review 76, 2: 323–329.
Largay, J. A., and Stickney, C. P. (1980). Cash flows, ratio analysis and the W. T. Grant company bankruptcy. Financial Analysts Journal July/August: 51–54.
McConville, D. J. (1996). Cash flow ratios gains respect as useful tool for credit Rating. Corporate Cashflow, January: 18.
Peterson, P. P., and Fabozzi, F. J. (2012). Analysis of Financial Statements, 3rd edition. Hoboken, NJ: John Wiley & Sons.
Stumpp, P. M. (2001). Critical failings of EBITDA as a cash flow measure. In F. J. Fabozzi (ed.), Bond Credit Analysis: Framework and Case Studies (pp. 139–170). Hoboken, NJ: John Wiley & Sons.