
Financial Statements
Financial statements are summaries of the operating, financing, and investment activities of a business. Financial statements should provide information useful to both investors and creditors in making credit, investment, and other business decisions. And this usefulness means that investors and creditors can use these statements to predict, compare, and evaluate the amount, timing, and uncertainty of future cash flows.1 In other words, financial statements provide the information needed to assess a company’s future earnings and, therefore, the cash flows expected to result from those earnings.
Information from financial statements is typically used in financial modeling for forecasting and valuation purposes. In this entry, we discuss the general principles that guide the preparation of financial statements (generally accepted accounting principles), the four basic financial statements (balance sheet, income statement, statement of cash flows, and statement of shareholders’ equity), and the assumptions underlying the preparation of financial statements.
ACCOUNTING PRINCIPLES
The accounting data in financial statements are prepared by the firm’s management according to a set of standards, referred to as generally accepted accounting principles (GAAP). Generally accepted accounting principles consist of the FASB Accounting Standards Codification, and, for publicly-traded companies, the rules and releases of the Securities and Exchange Commission.2
The financial statements of a company whose stock is publicly traded must, by law, be audited at least annually by independent public accountants (i.e., accountants who are not employees of the firm). In such an audit, the accountants examine the financial statements and the data from which these statements are prepared and attest—through the published auditor’s opinion—that these statements have been prepared according to GAAP. The auditor’s opinion focuses on whether the statements conform to GAAP and that there is adequate disclosure of any material change in accounting principles.
The financial statements are created using several assumptions that affect how we use and interpret the financial data:
- Transactions are recorded at historical cost. Therefore, the values shown in the statements are not market or replacement values, but rather reflect the original cost (adjusted for depreciation in the case of depreciable assets).
- The appropriate unit of measurement is the dollar. While this seems logical, the effects of inflation, combined with the practice of recording values at historical cost, may cause problems in using and interpreting these values.
- The statements are recorded for predefined periods of time. Generally, statements are produced to cover a chosen fiscal year or quarter, with the income statement and the statement of cash flows spanning a period’s time and the balance sheet and statement of shareholders’ equity as of the end of the specified period. But because the end of the fiscal year is generally chosen to coincide with the low point of activity in the operating cycle, the annual balance sheet and statement of shareholders’ equity may not be representative of values for the year.
- Statements are prepared using accrual accounting and the matching principle. Most businesses use accrual accounting, where income and revenues are matched in timing such that income is recorded in the period in which it is earned and expenses are reported in the period in which they are incurred in an attempt to generate revenues. The result of the use of accrual accounting is that reported income does not necessarily coincide with cash flows. Because the financial analyst is concerned ultimately with cash flows, he or she often must understand how reported income relates to a company’s cash flows.
- It is assumed that the business will continue as a going concern. The assumption that the business enterprise will continue indefinitely justifies the appropriateness of using historical costs instead of current market values because these assets are expected to be used up over time instead of sold.
- Full disclosure requires providing information beyond the financial statements. The requirement that there be full disclosure means that, in addition to the accounting numbers for such accounting items as revenues, expenses, and assets, narrative and additional numerical disclosures are provided in notes accompanying the financial statements. An analysis of financial statements is, therefore, not complete without this additional information.
- Statements are prepared assuming conservatism. In cases in which more than one interpretation of an event is possible, statements are prepared using the most conservative interpretation.
The financial statements and the auditors’ findings are published in the firm’s annual and quarterly reports sent to shareholders and the 10-K and 10-Q filings with the Securities and Exchange Commission (SEC). Also included in the reports, among other items, is a discussion by management, providing an overview of company events. The annual reports are much more detailed and disclose more financial information than the quarterly reports.
INFORMATION CONVEYED BY THE BASIC FINANCIAL STATEMENTS
In this section we will discuss the four basic financial statements and the information that they convey.
The Balance Sheet
The balance sheet is a report of the assets, liabilities, and equity of a firm at a point in time, generally at the end of a fiscal quarter or fiscal year. Assets are resources of the business enterprise, which are comprised of current or long-lived assets. How did the company finance these resources? It did so with liabilities and equity. Liabilities are obligations of the business enterprise that must be repaid at a future point in time, whereas equity is the ownership interest of the business enterprise. The relation between assets, liabilities and equity is simple, as reflected in the balance of what is owned and how it is financed, referred to as the accounting identity:
![]()
Assets
Assets are anything that the company owns that has a value. These assets may have a physical existence or not. Examples of physical assets include inventory items held for sale, office furniture, and production equipment. If an asset does not have a physical existence, we refer to it as an intangible asset, such as a trademark or a patent. You cannot see or touch an intangible asset, but it still contributes value to the company.
Assets may also be current or long-term, depending on how fast the company would be able to convert them into cash. Assets are generally reported in the balance sheet in order of liquidity, with the most liquid asset listed first and the least liquid listed last.
The most liquid assets of the company are the current assets. Current assets are assets that can be turned into cash in one operating cycle or one year, whichever is longer. This contrasts with the noncurrent assets, which cannot be liquidated quickly.
There are different types of current assets. The typical set of current assets is the following:
- Cash, bills, and currency are assets that are equivalent to cash (e.g., bank account).
- Marketable securities, which are securities that can be readily sold.
- Accounts receivable, which are amounts due from customers arising from trade credit.
- Inventories, which are investments in raw materials, work-in-process, and finished goods for sale.
A company’s need for current assets is dictated, in part, by its operating cycle. The operating cycle is the length of time it takes to turn the investment of cash into goods and services for sale back into cash in the form of collections from customers. The longer the operating cycle, the greater a company’s need for liquidity. Most firms’ operating cycle is less than or equal to one year.
Noncurrent assets comprise both physical and nonphysical assets. Plant assets are physical assets, such as buildings and equipment, and are reflected in the balance sheet as gross plant and equipment and net plant and equipment. Gross plant and equipment, or gross property, plant, and equipment, is the total cost of investment in physical assets; that is, what the company originally paid for the property, plant, and equipment that it currently owns. Net plant and equipment, or net property, plant, and equipment, is the difference between gross plant and equipment and accumulated depreciation, and represents the book value of the plant and equipment assets. Accumulated depreciation is the sum of depreciation taken for physical assets in the firm’s possession. Therefore,
Table 1 The Sample Company Balance Sheet for Years 1 and 2 (in millions)
| Year 2 | Year 1 | |
| Cash | $40 | $30 |
| Accounts receivable | 100 | 90 |
| Inventory | 180 | 200 |
| Other current assets | 10 | 10 |
| TOTAL CURRENT ASSETS | $350 | $330 |
| Property, plant, and equipment | $900 | $800 |
| Less accumulated depreciation | 270 | 200 |
| Net property, plant, and equipment | 630 | 600 |
| Intangible assets | 20 | 20 |
| TOTAL ASSETS | $1,000 | $950 |
| Accounts payable | $150 | $140 |
| Current maturities of long-term debt | 60 | 40 |
| TOTAL CURRENT LIABILITIES | $180 | $165 |
| Long-term debt | 300 | 250 |
| TOTAL LIABILITIES | $380 | $325 |
| Minority interest | 30 | 15 |
| Common stock | 50 | 50 |
| Additional paid-in capital | 100 | 100 |
| Retained earnings | 500 | 400 |
| TOTAL SHAREHOLDERS’ EQUITY | 650 | 550 |
| TOTAL LIABILITIES AND SHAREHOLDERS’ EQUITY | $1,000 | $950 |
Companies may present just the net plant and equipment figure on the balance sheet, placing the detail with respect to accumulated depreciation in a footnote. Interpreting financial statements requires knowing a bit about how assets are depreciated for financial reporting purposes. Depreciation is the allocation of the cost of an asset over its useful life (or economic life). In the case of the fictitious Sample Company, whose balance sheet is shown in Table 1, the original cost of the fixed assets (i.e., plant, property, and equipment)—less any write-downs for impairment—for year 2 is $900 million. The accumulated depreciation for Sample in Year 1 is $250 million; this means that the total depreciation taken on existing fixed assets over time is $270 milion. The net property, plant, and equipment account balance is $630 million. This is also referred to as the book value or carrying value of these assets.
Intangible assets are assets that are not financial instruments, yet have no physical existence, such as patents, trademarks, copyrights, franchises, and formulas. Intangible assets may be amortized over some period, which is akin to depreciation. Keep in mind that a company may own a number of intangible assets that are not reported on the balance sheet. A company may only include an intangible asset’s value on its balance sheet if (1) there are likely future benefits attributable specifically to the asset, and (2) the cost of the intangible asset can be measured.
Suppose a company has an active, ongoing investment in research and development to develop new products. It must expense what is spent on research and development each year because a given investment in R&D does not likely meet the two criteria because it is not until much later, after the R&D expense is made, that the economic viability of the investment is determined. If, on the other hand, a company buys a patent from another company, this cost may be capitalized and then amortized over the remaining life of the patent. So when you look at a company’s assets on its balance sheet, you may not be getting the complete picture of what it owns.
Liabilities
We generally use the terms “liability” and “debt” as synonymous terms, though “liability” is actually a broader term, encompassing not only the explicit contracts that a company has, in terms of short-term and long-term debt obligations, but also obligations that are not specified in a contract, such as environmental obligations or asset retirement obligations. Liabilities may be interest-bearing, such as a bond issue, or noninterest-bearing, such as amounts due to suppliers.
In the balance sheet, liabilities are presented in order of their due date and are often presented in two categories, current liabilities and long-term liabilities. Current liabilities are obligations due within one year or one operating cycle (whichever is longer). Current liabilities consist of:
- Accounts payable are amounts due to suppliers for purchases on credit.
- Wages and salaries payable are amounts due employees.
- Current portion of long-term indebtedness.
- Short-term bank loans.
Long-term liabilities are obligations that are due beyond one year. There are different types of long-term liabilities, including:
- Notes payables and bonds, which are indebtedness (loans) in the form of securities
- Capital leases, which are rental obligations that are long-term, fixed commitments
- Asset retirement liability, which is the contractual or statutory obligation to retire or decommission the asset and restore the site to required standards at the end of the asset’s life
- Deferred taxes, which are taxes that may have to be paid in the future that are currently not due, though they are expensed for financial reporting purposes. Deferred taxes arise from differences between accounting and tax methods (e.g., depreciation methods).
Note that although deferred income taxes are often referred to as liabilities, some analysts will classify them as equity if the deferral is perceived to be perpetual. For example, a company that buys new depreciable assets each year will always have some level of deferred taxes; in that case, an analyst will classify deferred taxes as equity.
Equity
The equity of a company is the ownership interest. The book value of equity, which for a corporation is often referred to as shareholders’ equity or stockholders’ equity, is basically the amount that investors paid the company for their ownership interest, plus any earnings (or less any losses), and minus any distributions to owners. For a corporation, equity is the amount that investors paid the corporation for the stock when it was initially sold, plus or minus any earnings or losses, less any dividends paid. Keep in mind that for any company, the reported amount of equity is an accumulation over time since the company’s inception (or incorporation, in the case of a corporation).
Shareholders’ equity is the carrying or book value of the ownership of a company. Shareholders’ equity comprises:
| + Par value | A nominal amount per share of stock (sometimes prescribed by law), or the stated value, which is a nominal amount per share of stock assigned for accounting purposes if the stock has no par value. |
| + Additional paid-in-capital | Also referred to as capital surplus, the amount paid for shares of stock by investors in excess of par or stated value. |
| − Treasury stock | The accounting value of shares of the firm’s own stock bought by the firm. |
| + Retained earnings | The accumulation of prior and current periods’ earnings and losses, less any prior or current periods’ dividends. |
| ± Accumulated comprehensive income or loss
|
The total amount of income or loss that arises from transactions that result in income or losses, yet are not reported through the income statement. Items giving rise to this income include foreign currency translation adjustments and unrealized gains or losses on available-for-sale investments. |
| = Shareholders’ equity |
A Note on Minority Interest
On many companies’ consolidated financial statements, you will notice a balance sheet account titled Minority Interest. When a company owns a substantial portion of another company, the accounting principles require that the company consolidate that company’s financial statements into its own. Basically what happens in consolidating the financial statements is that the parent company will add the accounts of the subsidiary to its accounts (i.e., subsidiary inventory + parent inventory = consolidated inventory).3 If the parent does not own 100% of the subsidiary’s ownership interest, an account is created, referred to as minority interest, which reflects the amount of the subsidiary’s assets not owned by the parent. This account will be presented between liabilities and equity on the consolidated balance sheet. Is it a liability or an equity account? It is neither.
A similar adjustment takes place on the income statement. The minority interest account on the income statement reflects the income (or loss) in proportion to the equity in the subsidiary not owned by the parent.
Structure of the Balance Sheet
Consider a simple balance sheet for the Sample Company shown in Table 1 for fiscal years Year 1 and Year 2. The most recent fiscal year’s data is presented in the left-most column of data. Notice that the accounting identity holds; that is, total assets are equal to the sum of the total liabilities and the total shareholders’ equity.
The Income Statement
The income statement is a summary of operating performance over a period of time (e.g., a fiscal quarter or a fiscal year). We start with the revenue of the company over a period of time and then subtract the costs and expenses related to that revenue. The bottom line of the income statement consists of the owners’ earnings for the period. To arrive at this “bottom line,” we need to compare revenues and expenses. The basic structure of the income statement includes the following:
| Sales or revenues | |
| Less: Cost of goods sold
(or cost of sales) |
|
| Gross profit | |
| Less: Selling and general
expenditures |
|
| Operating profit | |
| Less: Interest expense | |
| Net income before taxes | |
| Less: Taxes | |
| Net income | |
| Less: Preferred stock
dividends |
|
| Earnings available to common shareholders |
Though the structure of the income statement varies by company, the basic idea is to present the operating results first, followed by non-operating results. The cost of sales, also referred to as the cost of goods sold, is deducted from revenues, producing a gross profit; that is, a profit without considering all other, general operating costs. These general operating expenses are those expenses related to the support of the general operations of the company, which includes salaries, marketing costs, and research and development. Depreciation, which is the amortized cost of physical assets, is also deducted from gross profit. The amount of the depreciation expense represents the cost of the wear and tear on the property, plant, and equipment of the company.
Once we have the operating income, we have summarized the company’s performance with respect to the operations of the business. But there is generally more to a company’s performance. From operating income, we deduct interest expense and add any interest income. Further, adjustments are made for any other income or cost that is not a part of the company’s core business.
There are a number of other items that may appear as adjustments to arrive at net income. One of these is extraordinary items, which are defined as unusual and infrequent gains or losses. Another adjustment would be for the expense related to the write-down of an asset’s value.
In the case of the Sample Company, whose income statement is presented in Table 2, the income from operations—its core business—is $190 million, whereas the net income (i.e., the “bottom line”) is $100 million.
Table 2 The Sample Company Income Statement for Year 2 (in millions)
| Sales | $1,000 |
| Cost of goods sold | 600 |
| Gross profit | $400 |
| Depreciation | 50 |
| Selling, general, and administrative expenses | 160 |
| Operating profit | $190 |
| Interest expense | 23 |
| Income before taxes | $167 |
| Taxes | 67 |
| Net income | $100 |
Earnings Per Share
Companies provide information on earnings per share (EPS) in their annual and quarterly financial statement information, as well as in their periodic press releases. Generally, EPS is calculated as net income, divided by the number of shares outstanding. Companies must report both basic and diluted earnings per share.
Basic earnings per share is net income (minus preferred dividends), divided by the average number of shares outstanding. Diluted earnings per share is net income (minus preferred dividends), divided by the number of shares outstanding considering all dilutive securities (e.g., convertible debt, options). Diluted earnings per share, therefore, gives the shareholder information about the potential dilution of earnings. For companies with a large number of dilutive securities (e.g., stock options, convertible preferred stock or convertible bonds), there can be a significant difference between basic and diluted EPS. You can see the effect of dilution by comparing the basic and diluted EPS.
More on Depreciation
There are different methods that can be used to allocate an asset’s cost over its life. Generally, if the asset is expected to have value at the end of its economic life, the expected value, referred to as a salvage value (or residual value), is not depreciated; rather, the asset is depreciated down to its salvage value. There are different methods of depreciation that we classify as either straight-line or accelerated. Straight-line depreciation allocates the cost (less salvage value) in a uniform manner (equal amount per period) throughout the asset’s life. Accelerated depreciation allocates the asset’s cost (less salvage value) such that more depreciation is taken in the earlier years of the asset’s life. There are alternative accelerated methods available, including:
- Declining balance method, in which a constant rate is applied to a declining amount (the undepreciated cost)
- Sum-of-the-years’ digits method, in which a declining rate is applied to the asset’s depreciable basis
Another method is the units-of-activity method, in which the useful life is defined in terms of a measure of units of production or some other metric or use (e.g., hours, miles). The depreciation expense in any period is determined as the usage in that period.
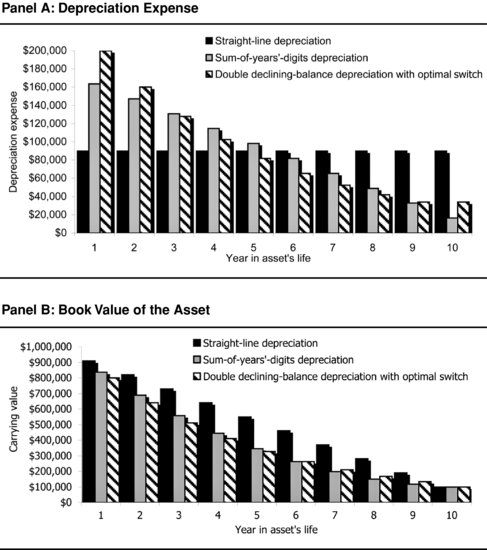
A common declining balance method is the double-declining balance method (DDB), which applies the rate that is twice that of the straight-line rate. In this case, the straight-line rate is 10% per year; therefore, the declining balance rate is 20% per year. We apply this rate of 20% against the original cost of $1,000,000, resulting in a depreciation expense in the first year of $200,000. In the second year, we apply this 20% against the undepreciated balance of $1,000,000 − 200,000 = $800,000, resulting in a depreciation of $160,000.
Because the declining balance methods result in more depreciation sooner, relative to straight-line, and lower depreciation in the later years, companies may switch to straight-line in these later years. The same amount is depreciated over the life of the asset, but the pattern—and depreciation’s impact on earnings—is modified slightly. In the case of the declining balance method, salvage value is not considered in the calculation of depreciation until the undepreciated balance reaches the salvage value.
For this same asset, the sum-of-the-years’ digits (SYD) depreciation for the first year is the rate of 10/55, or 18.18%, applied against the depreciable basis of $1,000,000 − 100,000 = $900,000:
![]()
We calculate the denominator as the “sum of the years”: 10 + 9 + 8 + 7 + 6 + 5 + 4 + 3 + 2 + 1 = 55. In the second year, the rate is 9/55 applied against the $900,000, and so on.
Accelerated methods result in higher depreciation expenses in earlier years, relative to straight-line, as can be seen in Figure 1. As a result, accelerated methods result in lower reported earnings in earlier years, relative to straight-line. When comparing companies, it is important to understand whether the companies use different methods of depreciation because the choice of depreciation method affects both the balance sheet (through the carrying value of the asset) and the income statement (through the depreciation expense).
Figure 1 Comparison of Depreciation Expense and Book Value
Depreciation expense each year for an asset with an original cost of $1,000,000, a salvage value of $10,000, and a 10-year useful life
A major source of deferred income taxes and deferred tax assets is the accounting methods used for financial reporting purposes and tax purposes. In the case of financial accounting purposes, the company chooses the method that best reflects how its assets lose value over time, though most companies use the straight-line method. However, for tax purposes the company has no choice but to use the prescribed rates of depreciation, using the Modified Accelerated Cost Recovery System (MACRS). For tax purposes, a company does not have discretion over the asset’s depreciable life or the rate of depreciation—they must use the MACRS system.
The MACRS system does not incorporate salvage value and is based on a declining balance system. The depreciable life for tax purposes may be longer than or shorter than that used for financial reporting purposes. For example, the MACRS rate for 3- and 5-year assets are as follows:
| Year | 3-year | 5-year |
| 1 | 33.33% | 20.00% |
| 2 | 44.45% | 32.00% |
| 3 | 14.81% | 19.20% |
| 4 | 7.41% | 11.52% |
| 5 | 11.52% | |
| 6 | 5.76% |
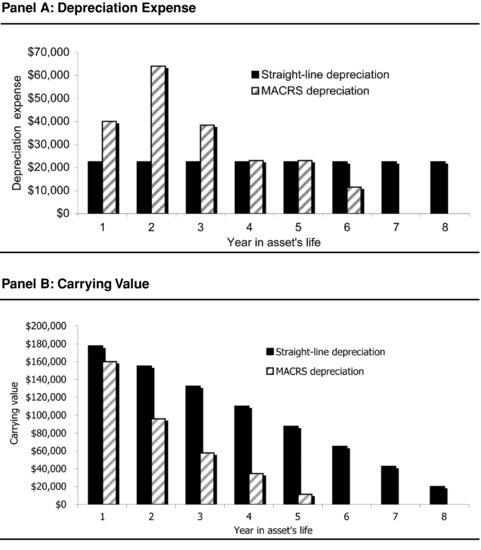
You’ll notice the fact that a 3-year asset is depreciated over four years and a 5-year asset is depreciated over six years. That is the result of using what is referred to as a half-year convention—using only half a year’s worth of depreciation in the first year of an asset’s life. This system results in a leftover amount that must still be depreciated in the last year (i.e., the fourth year in the case of a 3-year asset and the sixth year in the case of a 5-year asset). We provide a comparison of straight-line and MACRS depreciation in Figure 2. You can see that the methods produce different depreciation expenses, which result in the different income amounts for tax and financial reporting purposes.
Figure 2 Depreciation for Financial Accounting Purposes versus Tax Purposes
Consider an asset that costs $200,000 and has a salvage value of $20,000. If the asset has a useful life of 8 years, but is classified as a 5-year asset for tax purposes, the depreciation and book value of the asset will be different between the financial accounting records and the tax records
The Statement of Cash Flows
The statement of cash flows is the summary of a firm’s cash flows, summarized by operations, investment activities, and financing activities. A simplified cash flow statement is provided in Table 3 for the fictitious Sample Company. Cash flow from operations is cash flow from day-to-day operations. Cash flow from operating activities is basically net income adjusted for (1) noncash expenditures, and (2) changes in working capital accounts. The adjustment for changes in working capital accounts is necessary to adjust net income that is determined using the accrual method to a cash flow amount. Increases in current assets and decreases in current liabilities are positive adjustments to arrive at the cash flow; decreases in current assets and increases in current liabilities are negative adjustments to arrive at the cash flow.
Table 3 The Sample Company Statement of Cash Flows, for the period ending December 31, 2006 (in millions)
| Net income | $100 | |
| Add depreciation | 50 | |
| Subtract increase in accounts receivable | −10 | |
| Add decrease in inventory | 20 | |
| Add increase in accounts payable | 50 | |
| Cash flow from operations | $210 | |
| Retire debt | −$100 | |
| Cash flow for financing | −100 | |
| Purchase of equipment | −$100 | |
| Cash flow for investment | −100 | |
| Change in cash flow | $10 |
Cash flow for/from investing is the cash flows related to the acquisition (purchase) of plant, equipment, and other assets, as well as the proceeds from the sale of assets. Cash flow for/from financing activities is the cash flow from activities related to the sources of capital funds (e.g., buy back common stock, pay dividends, issue bonds).
Not all of the classifications required by accounting principles are consistent with the true flow for the three types of activities. For example, interest expense is a financing cash flow, yet it affects the cash flow from operating activities because it is a deduction to arrive at net income. This inconsistency is also the case for interest income and dividend income, both of which result from investing activities, but show up in the cash flow from operating activities through their contribution to net income.
The sources of a company’s cash flows can reveal a great deal about the company and its prospects. For example, a financially healthy company tends to consistently generate cash flows from operations (that is, positive operating cash flows) and invests cash flows (that is, negative investing cash flows). To remain viable, a company must be able to generate funds from its operations; to grow, a company must continually make capital investments.
The change in cash flow—also called net cash flow—is the bottom line in the statement of cash flows and is equal to the change in the cash account as reported on the balance sheet. For the Sample Company, shown in Table 3, the net change in cash flow is a positive $10 million; this is equal to the change in the cash account from $50 million in Year 1 to $60 million in Year 2.
By studying the cash flows of a company over time, we can gauge a company’s financial health. For example, if a company relies on external financing to support its operations (that is, reliant on cash flows from financing and not from operations) for an extended period of time, this is a warning sign of financial trouble up ahead.
The Statement of Stockholders’ Equity
The statement of stockholders’ equity (also referred to as the statement of shareholders’ equity) is a summary of the changes in the equity accounts, including information on stock options exercised, repurchases of shares, and Treasury shares. The basic structure is to include a reconciliation of the balance in each component of equity from the beginning of the fiscal year with the end of the fiscal year, detailing changes attributed to net income, dividends, purchases or sales of Treasury stock. The components are common stock, additional paid-in capital, retained earnings, and Treasury stock. For each of these components, the statement begins with the balance of each at the end of the previous fiscal period and then adjustments are shown to produce the balance at the end of the current fiscal period.
In addition, there is a reconciliation of any gains or losses that affect stockholders’ equity but which do not flow through the income statement, such as foreign-currency translation adjustments and unrealized gains on investments. These items are of interest because they are part of comprehensive income, and hence income to owners, but they are not represented on the company’s income statement.
Why Bother About the Footnotes?
Footnotes to the financial statements contain additional information, supplementing or explaining financial statement data. These notes are presented in both the annual report and the 10-K filing (with the SEC), though the latter usually provides a greater depth of information.
The footnotes to the financial statements provide information pertaining to:
- The significant accounting policies and practices that the company uses. This helps the analyst with the interpretation of the results, comparability of the results to other companies and to other years for the same company, and in assessing the quality of the reported information.
- Income taxes. The footnotes tell us about the company’s current and deferred income taxes, breakdowns by the type of tax (e.g., federal versus state), and the effective tax rate that the company is paying.
- Pension plans. The detail about pension plans, including the pension assets and the pension liability, is important in determining whether a company’s pension plan is overfunded or underfunded.
- Leases. You can learn about both the capital leases, which are the long-term lease obligations that are reported on the balance sheet, and about the future commitments under operating leases, which are not reflected on the balance sheet.
- Long-term debt. You can find detailed information about the maturity dates and interest rates on the company’s debt obligations.
The phrase “the devil is in the details” applies aptly to the footnotes of a company’s financial statement. Through the footnotes, a company is providing information that is crucial in analyzing a company’s financial health and performance. If footnotes are vague or confusing, as they were in the case of Enron prior to the break in the scandal, the analyst must ask questions to help understand this information.
ACCOUNTING FLEXIBILITY
The generally accepted accounting principles provide some choices in the manner in which some transactions and assets are accounted. For example, a company may choose to account for inventory, and hence costs of sales, using Last-in, First-out (LIFO) or First-in, First-out (FIFO). This is intentional because these principles are applied to a broad set of companies and no single set of methods offers the best representation of a company’s condition or performance for all companies. Ideally, a company’s management, in consultation with the accountants, chooses those accounting methods and presentations that are most appropriate for the company.
A company’s management has always had the ability to manage earnings through the judicious choice of accounting methods within the GAAP framework. The company’s “watchdogs” (i.e., the accountants) should keep the company’s management in check. However, recent scandals have revealed that the watchdog function of the accounting firms was not working well. Additionally, some companies’ management used manipulation of financial results and outright fraud to distort the financial picture.
The Sarbanes-Oxley Act of 2002 offers some comfort in terms of creating the oversight board for the auditing accounting firms. In addition, the Securities and Exchange Commission, the Financial Accounting Standards Board, and the International Accounting Standards Board are tightening some of the flexibility that companies had in the past.
Pro Forma Financial Data
Pro forma financial information is really a misnomer—the information is neither pro forma (that is, forward looking), nor reliable financial data. What is it? Creative accounting. It started during the Internet-tech boom in the 1990s and persists today: Companies release financial information that is prepared according to its own liking, using accounting methods that they create.
Why did companies start doing this? What is wrong with generally accepted accounting principles (GAAP)? During the Internet-tech stock boom, many startup companies quickly went public and then felt the pressures to generate profits. However, profits in that industry were hard to come by during that period of time. What some companies did is generate financial data that they included in company releases that reported earnings not calculated using GAAP—but rather by methods of their own. In some cases, these alternative methods hid a lot of the ills of these companies.
The use of pro forma financial data may be helpful, but also may be misleading to investors. Analysts routinely adjust published financial statement data to remove unusual, nonrecurring items. This can give the analyst a better predictor of the continued performance of the company. So what is wrong with the company itself doing this? Nothing, unless it becomes misleading, such as a company including its nonrecurring gains, but not including its nonrecurring losses. In concern for the possibility of misleading information being given to investors, the Securities and Exchange Commission now requires that if companies release pro forma financial data, they must also reconcile this data with GAAP.4
KEY POINTS
- There are four basic financial statements: the balance sheet, the income statement, the statement of cash flows, and the statement of stockholders’ equity.
- The balance sheet and the statement of shareholders’ equity are statements with values of accounts at a point in time. In the case of the balance sheet, the company presents data as of the end of the most recent two years; in the case of the statement of shareholders’ equity, from the latest fiscal year to the end. The income statement and the statement of cash flows provide data on earnings and cash flows over the period, whether that period is a fiscal quarter or year.
- The information conveyed in the footnotes is essential to the understanding of financial statements. There is detail in these footnotes that gives us a better idea of the financial health of the company. The financial statements and the accompanying footnotes provide the accounting principles that guide companies in the preparation of financial statements.
- Not only must the accounting methods that a company uses be understood, but the choices that a company has made among the available accounting methods should be understood.
NOTES
1. The purpose, focus, and objectives of financial statements are detailed in Financial Accounting Standards Board (1978, 1980).
2. Effective July 1, 2009, Financial Accounting Standards Board (FASB) Accounting Standards Codification.
3. There are other adjustments made for intercorporate transactions, but we will not go into these in this entry.
4. Securities and Exchange Commission RIN3235-A169, “Conditions for Use of Non-GAAP Financial Measures,” effective March 28, 2003.
REFERENCES
Financial Accounting Standards Board (1978). Objectives of financial reporting by business enterprises. Statement of Financial Accounting Concepts No. 1. Stamford, CT: FASB.
Financial Accounting Standards Board (1980). Qualitative characteristics of accounting information. Statement of Financial Accounting Concepts No. 2. Stamford, CT: FASB.
Financial Accounting Standards Board (2009). FASB Accounting Standards Codification. Stamford, CT: FASB.