
i
i
i
i
i
i
i
i
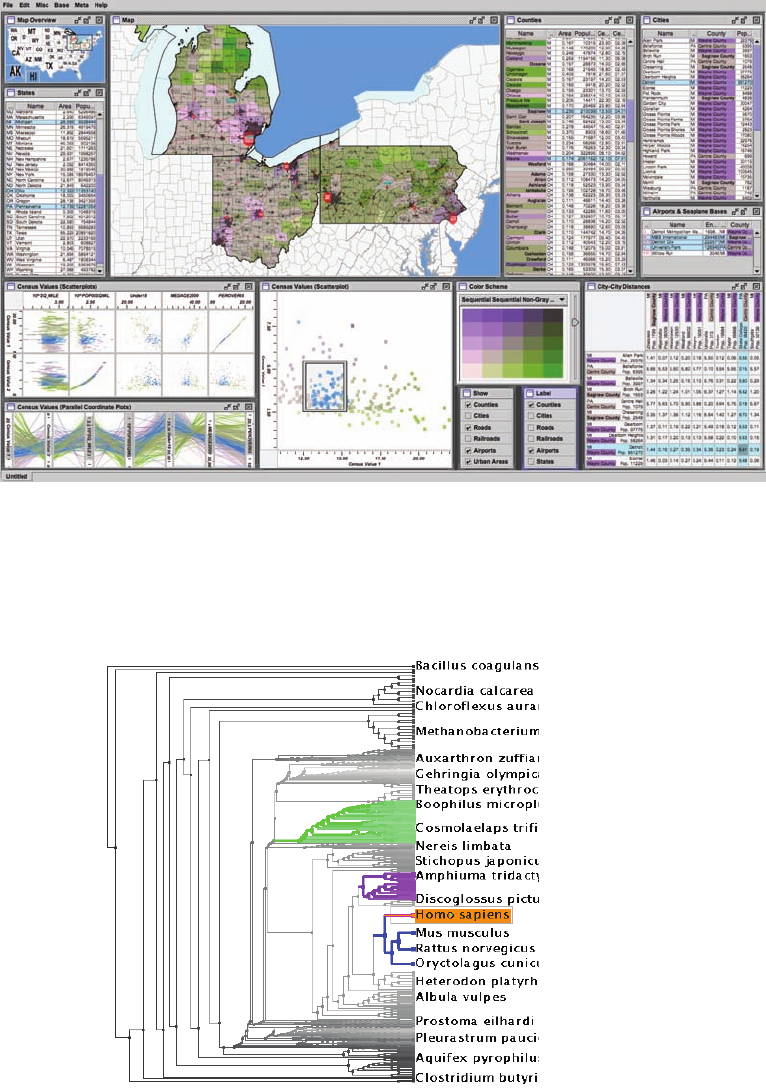
Plate XLVIII. The Improvise toolkit was used to create this multiple-view visualization.
Image courtesy Chris
Weaver.
(See also Figure 27.16.)
Plate XLIX. The Tree-
Juxtaposer system features
stretch and squish naviga-
tion and guaranteed vis-
ibility of regions marked
with colors (Munzner et al.,
2003). (See also Figure
27.17).
i
i
i
i
i
i
i
i
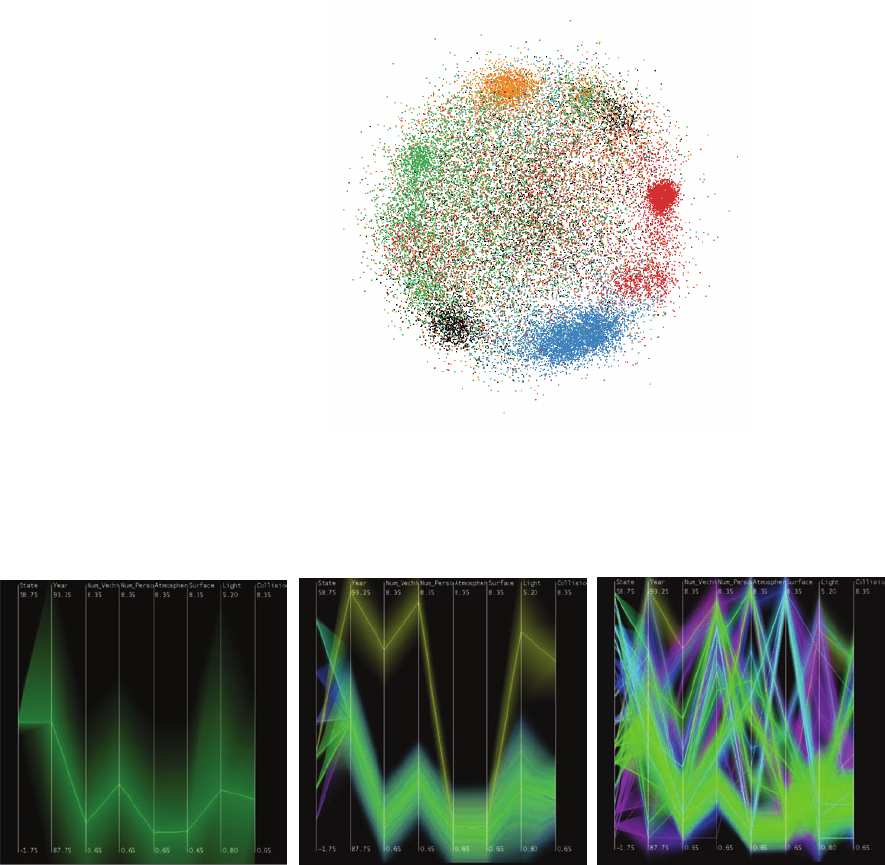
Plate LI. Hierarchical parallel coordinates show high-dimensional data at multiple levels of detail.
Image courtesy Matt
Ward
(Fua et al., 1999),
c
1999 IEEE. (See also Figure 27.21).
Plate L. Dimensionality
reduction with the Glimmer
multidimensional scaling
approach shows clusters
in a document dataset (In-
gram et al., 2009),
c
2009
IEEE. (See also Figure
27.19.)

i
i
i
i
i
i
i
i
Plate LII. Treemap showing a filesystem of nearly one million files.
Image courtesy Jean-Daniel Fekete
(Fekete & Plaisant,
2002),
c
2002 IEEE. (See also Figure 27.25.)
i
i
i
i
i
i
i
i
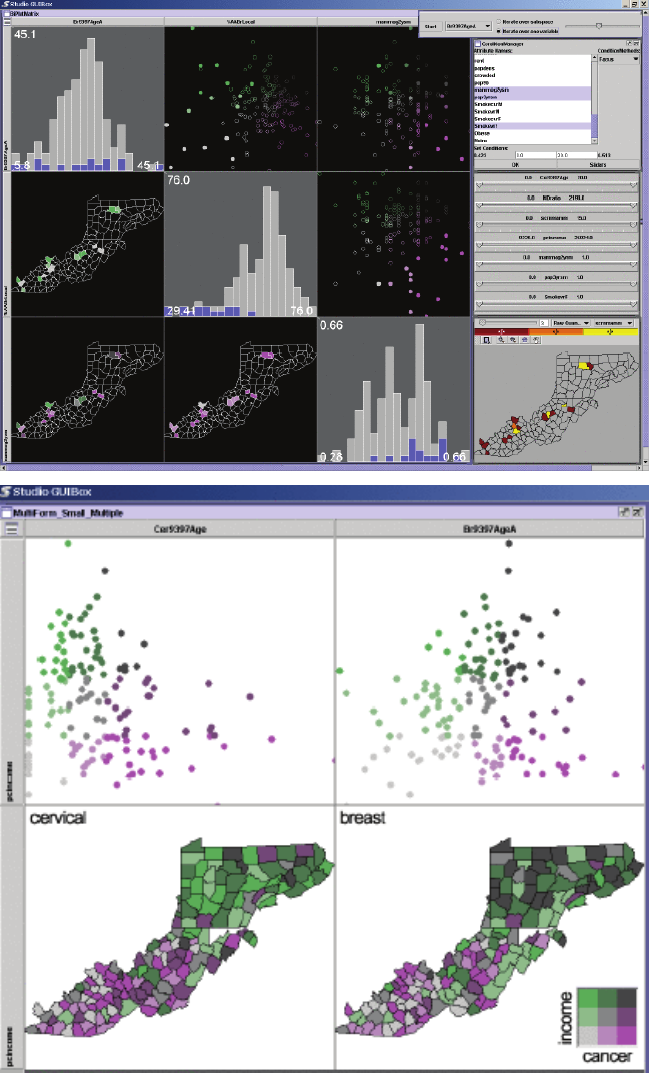
Plate LIII. Two matrices of linked small multiples showing cancer demographic
data (MacEachren et al., 2003),
c
2003 IEEE. (See also Figure 27.26).
..................Content has been hidden....................
You can't read the all page of ebook, please click here login for view all page.