
i
i
i
i
i
i
i
i
22.2. Visual Sensitivity 563
the receptors are narrowly tuned in their spatial sensitivity in order to be able to
detect fine detail in local contrast.
The fact that there are are only three types of color sensitive photoreceptors
in the human retina greatly simplifies the task of displaying colors on computer
monitors and in other graphical displays. Computer monitors display colors as
a weighted combination of three fixed color distributions. Most often, the three
colors are a distinct red, a distinct green, and a distinct blue. As a result, in
computer graphics, color is often represented by a red-green-blue (RGB) triple,
representing the intensities of red, green, and blue primaries needed to display
a particular color. Three basis colors are sufficient to display most perceptible
colors, since appropriately weighted combinations of three appropriately chosen
colors can produce metamers for these perceptible colors.
There are at least two significant problems with the RGB color representation.
The first is that different monitors have different spectral distributions for their
red, green, and blue primaries. As a result, perceptually correct color rendition
involves remapping RGB values for each monitor. This is of course only possible
if the original RGB values satisfy some well defined standard, which is often not
the case. See Chapter 21 for more information on this issue. The second problem
is that RGB values do not define a particular color in a way that corresponds to
subjective perception. When we see the color “yellow,” we do not have the sense
that it is made up of equal parts of red and green light. Rather, it looks like a single
color, with additional properties involving brightness and the “amount” of color.
Representing color as the output of the S-cones, M-cones, and L-cones is no help
either, since we have no more phenomenological sense of color as characterized
by these properties than we do as characterized by RGB display properties.
There are two different approaches to characterizing color in a way that more
closely reflects human perception. The various CIE color spaces aim to to be
“perceptually uniform” so that the magnitude of the difference in the represented
values of two colors is proportional to the perceived difference in color (Wyszecki
& Stiles, 2000). This turns out to be a difficult goal to accomplish, and there
have been several modifications to the CIE model over the years. Furthermore,
while one of the dimensions of the CIE color spaces corresponds to perceived
brightness, the other two dimensions that specify chromaticity have no intuitive
meaning.
The second approach to characterizing color in a more natural manner starts
with the observation that there are three distinct and independent properties that
dominate the subjective sense of color. Lightness, the apparent brightness of a
surface, has already been discussed. Saturation refers to the purity or vividness
of a color. Colors can range from totally unsaturated gray to partially saturated
i
i
i
i
i
i
i
i
564 22. Visual Perception
pastels to fully saturated “pure” colors. The third property, hue, corresponds most
closely to the informal sense of the word “color” and is characterized in a manner
similar to colors in the visible spectrum, ranging from dark violet to dark red.
Plate XI shows a plot of the hue-saturation-lightness (HSV) color space. Since
the relationship between brightness and lightness is both complex and not well
understood, HSV color spaces almost always use brightness instead of attempting
to estimate lightness. Unlike wavelengths in the spectrum, however, hue is usu-
ally represented in a manner that reflects the fact that the extremes of the visible
spectrum are actually similar in appearance (Plate XII). Simple transformations
exist between RGB and HSV representations of a particular color value. As a
result, while the HSV color space is motivated by perceptual considerations, it
contains no more information than does an RGB representation.
The hue-saturation-lightness approach to describing color is based on the
spectral distribution at a single point and so only approximates the perceptual
response to spectral distributions of light distributed over space. Color percep-
tion is subject to similar constancy and simultaneous contrast effects as is light-
ness/brightness, neither of which are captured in the RGB representation and as
a result are not captured in the HSV representation. For an example of color
constancy, look at a piece of white paper indoors under incandescent light and
outdoors under direct sunlight. The paper will look “white” in both cases, even
though incandescent light has a distinctly yellow hue and so the light reflected off
of the paper will also have a yellow hue, while sunlight has a much more uniform
color spectrum.
Another aspect of color perception not captured by either the CIE color spaces
or HSV encoding is the fact that we see a small number of distinct colors when
looking at a continuous spectrum of visible light (Plate X) or in a naturally oc-
curring rainbow. For most people, the visible spectrum appears to be divided into
four to six distinct colors: red, yellow, green, and blue, plus perhaps light blue and
purple. Considering non-spectral colors as well, there are only eleven basic color
terms commonly used in English: red, green, blue, yellow, black, white, gray,
orange, purple, brown,andpink. The partitioning of the intrinsically continuous
space of spectral distributions into a relatively small set of perceptual categories
associated with well defined linguistic terms seems to be a basic property of per-
ception, not just a cultural artifact (Berlin & Kay, 1969). The exact nature of the
process, however, is not well understood.
22.2.3 Dynamic Range
Natural illumination varies in intensity over 6 orders of magnitude (Figure 22.12).
The human vision system is able to operate over this full range of brightness lev-

i
i
i
i
i
i
i
i
22.2. Visual Sensitivity 565
els. However, at any one point in time the visual system is only able to detect vari-
ations in light intensity over a much smaller range. As the average brightness to
which the visual system is exposed changes over time, the range of discriminable
brightnesses changes in a corresponding manner. This effect is most obvious if we
move rapidly from a brightly lit outdoor area to a very dark room. At first, we are
direct sunlight
10
5
indoor lighting
10
2
moonlight
10
−1
starlight
10
−3
Figure 22.12. Approx-
imate luminance level of
a white surface under dif-
ferent types of illumination
in candelas per meter
squared (cd/m
2
). (Wandell,
1995)
.
able to see little. After a while, however, details in the room start to become ap-
parent. The dark adaptation that occurs involves a number physiological changes
in the eye. It takes several minutes for significant dark adaptation to occur and 40
minutes or so for complete dark adaptation. If we then move back into the bright
light, not only is vision difficult but it can actually be painful. Light adaptation is
required before it is again possible to see clearly. Light adaptation occurs much
more quickly than dark adaptation, typically requiring less than a minute.
The two classes of photoreceptors in the human retina are sensitive to dif-
ferent ranges of brightness. The cones provide visual information over most of
what we consider normal lighting conditions, ranging from bright sunlight to dim
indoor lighting. The rods are only effective at very low light levels. Photopic
vision involves bright light in which only the cones are effective. Scotopic vision
involves dark light in which only the rods are effective. There is a range of inten-
sities within which both cones and rods are sensitive to changes in light, which is
referred to as mesopic conditions (see Chapter 23).
22.2.4 Field-of-View and Acuity
Each eye in the human visual system has a field-of-view of approximately 160
◦
horizontal by 135
◦
vertical. With binocular viewing, there is only partial overlap
between the fields-of-view of the two eyes. This results in a wider overall field-of-
view (approximately 200
◦
horizontal by 135
◦
vertical), with the region of overlap
being approximately 120
◦
horizontal by 135
◦
vertical.
With normal or corrected-to-normal vision, we usually have the subjective
experience of being able to see relatively fine detail wherever we look. This is an
illusion, however. Only a small portion of the visual field of each eye is actually
sensitive to fine detail. To see this, hold a piece of paper covered with normal-
sized text at arms length, as shown in Figure 22.13. Cover one eye with the hand
not holding the paper. While staring at your thumb and not moving your eye, note
that the text immediately above your thumb is readable while the text to either
side is not. High acuity vision is limited to a visual angle slightly larger than
your thumb held at arm’s length. We do not normally notice this because the
eyes usually move frequently, allowing different regions of the visual fieldtobe
viewed at high resolution. The visual system then integrates this information over
i
i
i
i
i
i
i
i
566 22. Visual Perception
Figure 22.13. If you hold a page of text at arm’s length and stare at your thumb, only the
text near your thumb will be readable.
Photo by Peter Shirley.
time to produce the subjective experience of the whole visual field being seen at
high resolution.
There is not enough bandwidth in the human visual cortex to process the infor-
mation that would result if there was a dense sampling of image intensity over the
whole of the retina. The combination of variable density photoreceptor packing
in the retina and a mechanism for rapid eye movements to point at areas of in-
terest provides a way to simultaneously optimize acuity and field-of-view. Other
animals have evolved different ways of balancing acuity and field-of-view that
are not dependent on rapid eye movements. Some have only high acuity vision,
but limited to a narrow field-of-view. Others have wide field-of-view vision, but
limited ability to see detail.
The eye motions which focus areas of interest in the environment on the fovea
are called saccades. Saccades occur very quickly. The time from a triggering
stimulus to the completion of the eye movement is 150–200 ms. Most of this time
is spent in the vision system planning the saccade. The actual motion takes 20 ms
or so on average. The eyes are moving very quickly during a saccade, with the
maximum rotational velocity often exceeding 500
◦
/second. Between saccades,
the eyes point towards an area of interest (fixate), taking 300 ms or so to acquire
fine detail visual information. The mechanism by which multiple fixations are
integrated to form an overall subjective sense of fine detail over a wide field of
view is not well understood.
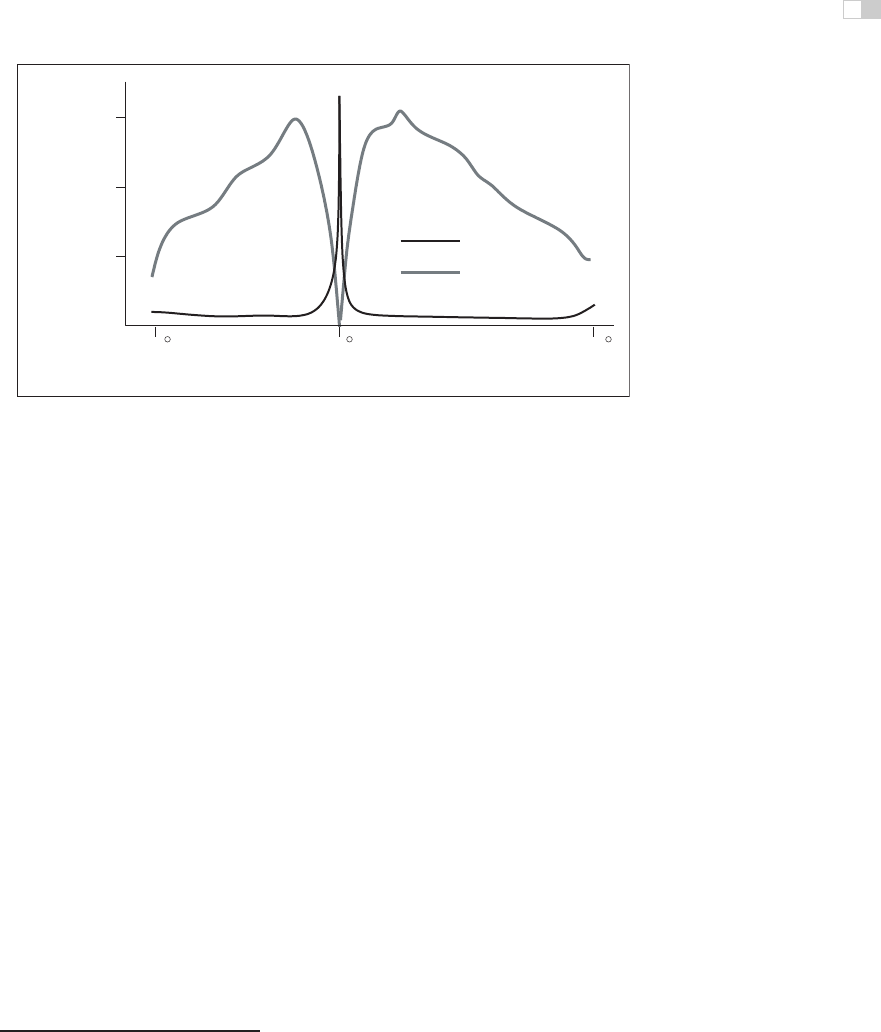
Figure 22.14 shows the variable packing density of cones and rods in the hu-
man retina. The cones, which are responsible for vision under normal lighting,
are packed most closely at the fovea of the retina (Figure 22.14). When the eye
i
i
i
i
i
i
i
i
22.2. Visual Sensitivity 567
70 900
towards midline
away from midline
fovea
2
receptor density / mm
5
1.5 x 10
1.0 x 10
5
5
0.5 x 10
cones
rods
Figure 22.14. Density of rods and cone in the human retina (after Osterberg (1935)).
is fixated at a particular point in the environment, the image of that point falls on
the fovea. The higher packing density of cones at the fovea results in a higher
sampling frequency of the imaged light (see Chapter 9) and hence greater detail
in the sampled pattern. Foveal vision encompasses about 1.7
◦
, which is the same
visual angle as the width of your thumb held at arm’s length.
While a version of Figure 22.14 appears in most introductory texts on human
visual perception, it provides only a partial explanationfor the neurophysiological
limitations on visual acuity. The output of individual rods and cones are pooled in
various ways by neural interconnects in the eye, before the information is shipped
along the optic nerve to the visual cortex.
3
This pooling filters the signal provided
by the pattern of incident illumination in ways that have important impacts on the
patterns of light that are detectable. In particular, the farther away from the fovea,
the larger the area over which brightness is averaged. As a consequence, spatial
acuity drops sharply away from the fovea. Most figures showing rod and cone
packing density indicate the location of the retinal blind spot,wherethenerve
bundle carrying optical information from the eye to the brain passes through the
retina, and there is no sensitivity to light. By and large, the only practical impact
of the blind spot on real-world perception is its use as an illusion in introduc-
tory perception texts, since normal eye movements otherwise compensate for the
temporary loss of information.
3
All of the cells in the optic nerve and almost all cells in visual cortex have an associated retinal
receptive field. Patterns of light hitting the retina outside of a cell’s receptive field have no effect on
the firing rate of that cell.
..................Content has been hidden....................
You can't read the all page of ebook, please click here login for view all page.