

i
i
i
i
i
i
i
i
546 21. Color
Color space XYZ to RGB matrix RGB to XYZ matrix Nonlinear transform
sRGB
⎡
⎣
3.2405 −1.5371 −0.4985
−0.9693 1.8760 0.0416
0.0556 −0.2040 1.0572
⎤
⎦
⎡
⎣
0.4124 0.3576 0.1805
0.2126 0.7152 0.0722
0.0193 0.1192 0.9505
⎤
⎦
γ =1/2.4 ≈ 0.42
f =0.055
s =12.92
t =0.0031308
Adobe RGB (1998)
⎡
⎣
2.0414 −0.5649 −0.3447
−0.9693 1.8760 0.0416
0.0134 −0.1184 1.0154
⎤
⎦
⎡
⎣
0.5767 0.1856 0.1882
0.2974 0.6273 0.0753
0.0270 0.0707 0.9911
⎤
⎦
γ =
1
2
51
256
≈
1
2.2
f =N.A.
s =N.A.
t =N.A.
HDTV (HD-CIF)
⎡
⎣
3.2405 −1.5371 −0.4985
−0.9693 1.8760 0.0416
0.0556 −0.2040 1.0572
⎤
⎦
⎡
⎣
0.4124 0.3576 0.1805
0.2126 0.7152 0.0722
0.0193 0.1192 0.9505
⎤
⎦
γ =0.45
f =0.099
s =4.5
t =0.018
NTSC (1953)/
ITU-R BT.601-4
⎡
⎣
1.9100 −0.5325 −0.2882
−0.9847 1.9992 −0.0283
0.0583 −0.1184 0.8976
⎤
⎦
⎡
⎣
0.6069 0.1735 0.2003
0.2989 0.5866 0.1145
0.0000 0.0661 1.1162
⎤
⎦
γ =0.45
f =0.099
s =4.5
t =0.018
PAL/SECAM
⎡
⎣
3.0629 −1.3932 −0.4758
−0.9693 1.8760 0.0416
0.0679 −0.2289 1.0694
⎤
⎦
⎡
⎣
0.4306 0.3415 0.1783
0.2220 0.7066 0.0713
0.0202 0.1296 0.9391
⎤
⎦
γ =0.45
f =0.099
s =4.5
t =0.018
SMPTE-C
⎡
⎣
3.5054 −1.7395 −0.5440
−1.0691 1.9778 0.0352
0.0563 −0.1970 1.0502
⎤
⎦
⎡
⎣
0.3936 0.3652 0.1916
0.2124 0.7010 0.0865
0.0187 0.1119 0.9582
⎤
⎦
γ =0.45
f =0.099
s =4.5
t =0.018
SMPTE-240M
⎡
⎣
2.042 −0.565 −0.345
−0.894 1.815 0.032
0.064 −0.129 0.912
⎤
⎦
⎡
⎣
0.567 0.190 0.193
0.279 0.643 0.077
0.000 0.073 1.016
⎤
⎦
γ =0.45
f =0.1115
s =4.0
t =0.0228
Wide Gamut
⎡
⎣
1.4625 −0.1845 −0.2734
−0.5228 1.4479 0.0681
0.0346 −0.0958 1.2875
⎤
⎦
⎡
⎣
0.7164 0.1010 0.1468
0.2587 0.7247 0.0166
0.0000 0.0512 0.7740
⎤
⎦
γ =N.A.
f =N.A.
s =N.A.
t =N.A.
Figure 21.10. Transformations for standard RGB color spaces (after (Pascale, 2003)).
This transform is known as the Hunt-Pointer-Estevez transform (Hunt, 2004) and
is used in chromatic adaptation transforms as well as in color appearance model-
ing.
21.2.4 CIE 1976 L
∗
a
∗
b
∗
Color opponent spaces are characterized by a channel representing an achromatic
channel (luminance), as well as two channels encoding color opponency. These
are frequently red-green and yellow-blue channels. These color opponent chan-

i
i
i
i
i
i
i
i
21.2. Color Spaces 547
nels thus encode two chromaticities along one axis, which can have both positive
and negative values. For instance, a red-green channel encodes red for positive
values and green for negative values. The value zero encodes a special case: neu-
tral which is neither red or green. The yellow-blue channel works in much the
same way.
As at least two colors are encoded on each of the two chromatic axes, it is not
possible to encode a mixture of red and green. Neither is it possible to encode
yellow and blue simultaneously. While this may seem a disadvantage, it is known
that the human visual system computes similar attributes early in the visual path-
way. As a result, humans are not able to perceive colors that are simultaneously
red and green, or yellow and blue. We do not see anything resembling reddish-
green, or yellowish-blue. We are, however, able to perceive mixtures of colors
such as yellowish-red (orange) or greenish-blue, as these are encoded across the
chromatic channels.
The most relevant color opponent system for computer graphics is the CIE
1976 L
∗
a
∗
b
∗
color model. It is a perceptually more or less uniform color space,
useful, among other things, for the computation of color differences. It is also
known as CIELAB.
The input to CIELAB are the stimulus (X, Y, Z) tristimulus values as well as
the tristimulus values of a diffuse white reflecting surface that is lit by a known il-
luminant, (X
n
,Y
n
,Z
n
). CIELAB therefore goes beyond being an ordinary color
space, as it takes into account a patch of color in the context of a known illumina-
tion. It can thus be seen as a rudimentary color appearance space.
The three channels defined in CIELAB are L
∗
, a
∗
,andb
∗
.TheL
∗
channel
encodes the lightness of the color, i.e., the perceived reflectance of a patch with
tristimulus value (X, Y, Z).Thea
∗
and b
∗
are chromatic opponent channels. The
transform between XYZ and CIELAB is given by
⎡
⎣
L
∗
a
∗
b
∗
⎤
⎦
=
⎡
⎣
0 116 0 −16
500 −500 0 0
0 200 −200 0
⎤
⎦
⎡
⎢
⎢
⎣
f (X/X
n
)
f (Y/Y
n
)
f (Z/Z
n
)
1
⎤
⎥
⎥
⎦
.
The function f is defined as
f(r)=
⎧
⎨
⎩
3
√
r for r>0.008856,
7.787 r +
16
116
for r ≤ 0.008856.
As can be seen from this formulation, the chromatic channels do depend on the
luminance Y . Although this is perceptually accurate, it means that we cannot plot
the values of a
∗
and b
∗
in a chromaticity diagram. The lightness L
∗
is normalized

i
i
i
i
i
i
i
i
548 21. Color
between 0 and 100 for black and white. Although the a
∗
and b
∗
channels are not
explicitly constrained, they typically in the range [−128, 128].
As CIELAB is approximately perceptually linear, it is possible to take two
colors, convert them to CIELAB, and then estimate the perceived color difference
by computing the Euclidean distance between them. This leads to the following
color difference formula:
ΔE
∗
ab
=
*
(ΔL
∗
)
2
+(Δa
∗
)
2
+(Δb
∗
)
2
+
1/2
.
The letter E stands for difference in sensation (in German, Empfindung) (Judd,
1932).
Finally, the inverse transform between CIELAB and XYZ is given by
X = X
n
⎧
⎪
⎪
⎨
⎪
⎪
⎩
L
∗
116
+
a
∗
500
+
16
116
3
if L
∗
> 7.9996,
1
7.787
L
∗
116
+
a
∗
500
if L
∗
≤ 7.9996,
Y = Y
n
⎧
⎪
⎨
⎪
⎩
L
∗
116
+
16
116
3
if L
∗
> 7.9996,
1
7.787
L
∗
116
if L
∗
≤ 7.9996,
Z = Z
n
⎧
⎪
⎪
⎨
⎪
⎪
⎩
L
∗
116
−
b
∗
200
+
16
116
3
if L
∗
> 7.9996,
1
7.787
L
∗
116
−
b
∗
200
if L
∗
≤ 7.9996.
21.3 Chromatic Adaptation
The CIELAB color space just described takes as input both a tristimulus value of
the stimulus and the tristimulus value of light reflected off a white diffuse patch.
As such, it forms the beginnings of a system in which the viewing environment is
taken into account.
The environmentin which we observe objects andimages has a large influence
on how we perceive those objects. The range of viewing environments that we
encounter in daily life is very large, from sunlight to starlight and from candlelight
to fluorescent light. The lighting conditions not only constitute a very large range
in the amount of light that is present, but also vary greatly in the color of the
emitted light.
i
i
i
i
i
i
i
i
21.3. Chromatic Adaptation 549
The human visual system accommodates these changes in the environment
through a process called adaptation. Three different types of adaptation can be
distinguished, namely light adaptation, dark adaptation, and chromatic adaptation.
Light adaptation refers to the changes that occur when we move from a very dark
to a very light environment. When this happens, at first we are dazzled by the
light, but soon we adapt to the new situation and begin to distinguish objects in
our environment. Dark adaptation refers to the opposite—when we go from a
light environment to a dark environment. At first, we see very little, but after a
given amount of time, details will start to emerge. The time needed to adapt to
the dark is generally much longer than for light adaptation.
Chromatic adaptation refers to our ability to adapt, and largely ignore, vari-
ations in the color of the illumination. Chromatic adaptation is, in essence, the
biological equivalent of the white balancing operation that is available on most
modern cameras. The human visual system effectively normalizes the viewing
conditions to present a visual experience that is fairly consistent. Thus, we ex-
hibit a certain amount of color constancy: object reflectances appear relatively
constant despite variations in illumination.
Although we are able to largely ignore changes in viewing environment, we
are not able to do so completely. For instance, colors appear much more col-
orful on a sunny day than they do on a cloudy day. Although the appearances
have changed, we do not assume that object reflectances themselves have actually
changed their physical properties. We thus understand that the lighting conditions
have influenced the overall color appearance.
Nonetheless, color constancy does apply to chromatic content. Chromatic
adaptation allows white objects to appear white for a large number of lighting
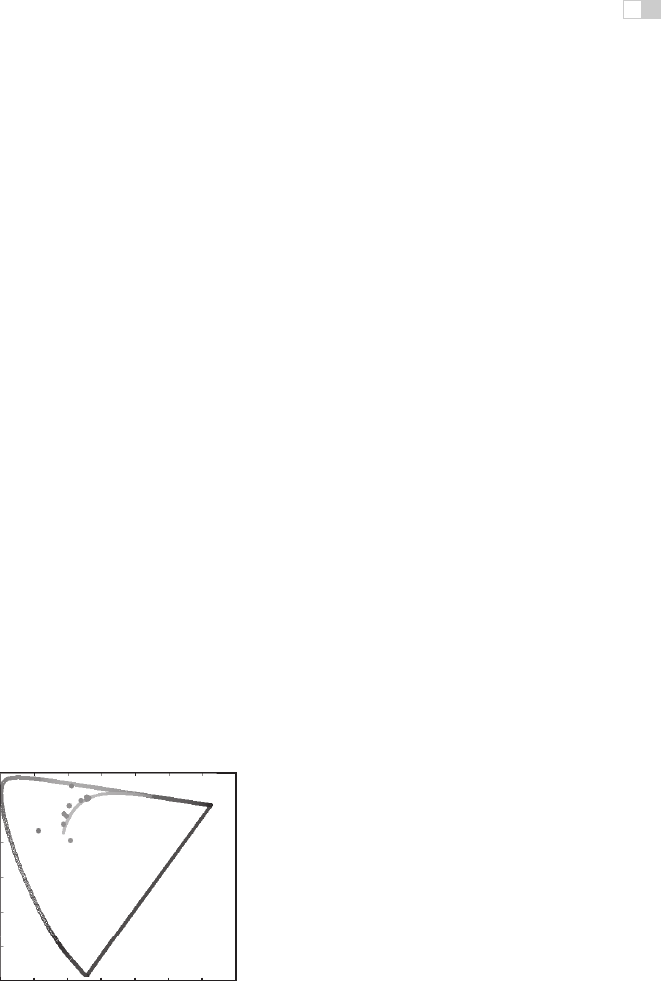
conditions, as shown in Figure 21.11.
v'
u'
0.5
0.70.60.50.40.30.20.10.0
0.0
0.1
0.2
0.3
0.4
Figure 21.11. A series of light sources plotted in the CIE u
v
chromaticity diagram. A white
piece of paper illuminated by any of these light sources maintains a white color appearance.
(See also Plate XXXI.)

i
i
i
i
i
i
i
i
550 21. Color
400 450 500 550 600 650 700
0.0
0.1
0.2
0.3
0.4
0.5
0.6
0.7
0.8
0.9
1.0
Wavelength (nm)
Sensitivity
Color representing
CIE A rendered into
the sRGB color space
L
M
S
CIE A
Solid lines: relative cone responses
Dashed lines: relative adapted cone responses
Figure 21.12. An example of von Kries–style independent photoreceptor gain control. The
relative cone responses (solid line) and the relative adapted cone responses to CIE illuminant
A (dashed) are shown. The separate patch of color represents CIE illuminant A rendered into
the sRGB color space. (See also Plate XXXII.)
Computational models of chromatic adaptation tend to focus on the gain con-
trol mechanism in the cones. One of the simplest models assumes that each cone
adapts independently to the energy that it absorbs. This means that different cone
types adapt differently dependent on the spectrum of the light being absorbed.
Such adaptation can then be modeled as an adaptive and independent rescaling of
the cone signals:
L
a
= αL,
M
a
= βM,
S
a
= γS,
where (L
a
,M
a
,S
a
) are the chromatically adapted cone signals, and α, β,andγ
are the independent gain controls which are determined by the viewing environ-
ment. This type of independent adaptation is also known as von-Kries adaptation.
An example is shown in Figure 21.12.
The adapting illumination can be measured off a white surface in the scene. In
the ideal case, this would be a Lambertian surface. In a digital image, the adapting
illumination can also be approximated as the maximum tristimulus values of the
scene. The light measured or computed in this manner is the adapting white, given
by (L
w
,M
w
,S
w
). Von Kries adaptation is then simply a scaling by the reciprocal
..................Content has been hidden....................
You can't read the all page of ebook, please click here login for view all page.