
i
i
i
i
i
i
i
i
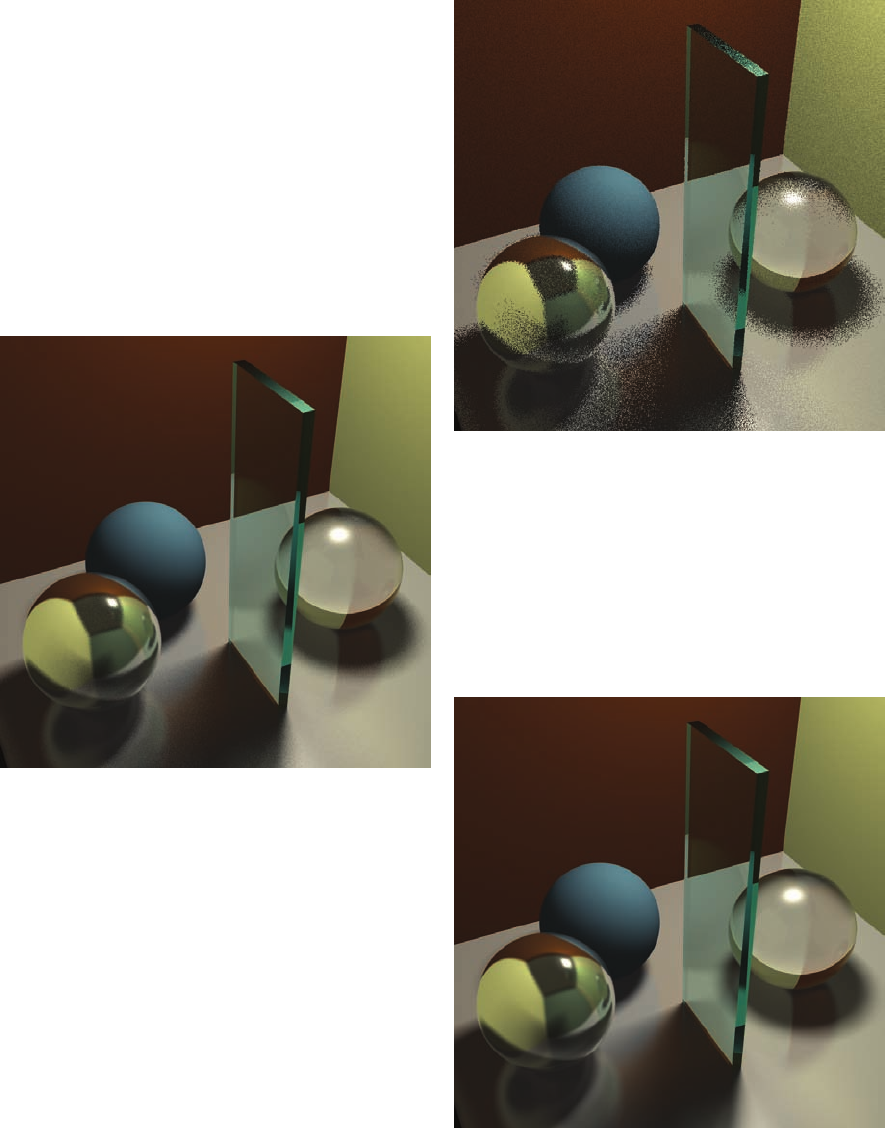
Plate XXIII. Distribution ray-traced images with 1 sample
per pixel, 16 samples per pixel, and 256 samples per pixel.
Images courtesy Jason Waltman.

i
i
i
i
i
i
i
i
Plate XXIV. Top: A dif-
fuse shading model is used.
Bottom: Subsurface scatter-
ing is allowed using a tech-
nique from “A Practical Model
for Sub-surface Light Trans-
port,” Jensen et al., Proceed-
ings of SIGGRAPH 2001.
Im-
ages courtesy Henrik Jensen.

i
i
i
i
i
i
i
i
Plate XXV. Ray-traced and
photon-mapped image of
an interior. Most of the light-
ing is indirect.
Image cour-
tesy Henrik Jensen.
Plate XXVI. The brightly
colored pattern in the
shadow is a “caustic” and
is a product of light focused
through the glass. It was
computed using photon
tracing.
Image courtesy
Henrik Jensen.

i
i
i
i
i
i
i
i
Plate XXVII. Top: A set of
ellipsoids approximates the
model. Bottom: The ellip-
soids are used to create a
gravity-like implicit function
which is then displaced.
Im-
age courtesy Eric Levin.
i
i
i
i
i
i
i
i
9.5. Sampling Theory 227
Recall that δ is the identity for convolution. This means that
(
ˆ
fs
1/T
)(u)=
∞
i=−∞
ˆ
f(u −i/T );
that is, convolving with the impulse train makes a whole series of equally spaced
copies of the spectrum of f. A good intuitive interpretation of this seemingly odd
result is that all those copies just express the fact (as we saw back in Section 9.1.1)
that frequencies that differ by an integer multiple of the sampling frequency are
indistinguishable once we have sampled—they will produce exactly the same set
of samples. The original spectrum is called the base spectrum and the copies are
known as alias spectra.
The trouble begins if these copies of the signal’s spectrum overlap, which will
happen if the signal contains any significant content beyond half the sample fre-
quency. When this happens, the spectra add, and the information about different
frequencies is irreversibly mixed up. This is the first place aliasing can occur, and
if it happens here, it’s due to undersampling—using too low a sample frequency
for the signal.
Suppose we reconstruct the signal using the nearest-neighbor technique. This
is equivalent to convolving with a box of width 1. (The discrete-continuous con-
volution used to do this is the same as a continuous convolution with the series
of impulses that represent the samples.) The convolution-multiplication property
means that the spectrum of the reconstructed signal will be the product of the
spectrum of the sampled signal and the spectrum of the box. The resulting recon-
structed Fourier transform contains the base spectrum (though somewhat attenu-
ated at higher frequencies), plus attenuated copies of all the alias spectra. Because
the box has a fairly broad Fourier transform, these attenuated bits of alias spectra
are significant, and they are the second form of aliasing, due to an inadequate
reconstruction filter. These alias components manifest themselves in the image as
the pattern of squares that is characteristic of nearest-neighbor reconstruction.
Preventing Aliasing in Sampling
To do high quality sampling and reconstruction, we have seen that we need to
choose sampling and reconstruction filters appropriately. From the standpoint of
the frequency domain, the purpose of lowpass filtering when sampling is to limit
the frequency range of the signal so that the alias spectra do not overlap the base
spectrum. Figure 9.49 shows the effect of sample rate on the Fourier transform of
the sampled signal. Higher sample rates move the alias spectra farther apart, and
eventually whatever overlap is left does not matter.
..................Content has been hidden....................
You can't read the all page of ebook, please click here login for view all page.