

i
i
i
i
i
i
i
i
2 1
2 1
Erik Reinhard and Garrett Johnson
Color
Photons are the carriers of optical information. They propagate through media
taking on properties associated with waves. At surface boundaries they inter-
act with matter, behaving more as particles. They can also be absorbed by the
retina, where the information they carry is transcoded into electrical signals that
are subsequently processed by the brain. It is only there that a sensation of color
is generated.
As a consequence, the study of color in all its guises touches upon several
different fields: physics for the propagation of light through space; chemistry for
its interaction with matter; neuroscience and psychology for aspects relating to
perception and cognition of color (Reinhard et al., 2008).
In computer graphics, we traditionally take a simplified view of how light
propagates through space. Photons travel along straight paths until they hit a sur-
face boundary and are then reflected according to a reflection function of some
sort. A single photon will carry a certain amount of energy, which is represented
by its wavelength. Thus, a photon will have only one wavelength. The relation-
ship between its wavelength λ and the amount of energy it carries (ΔE)isgiven
by
λ ΔE = 1239.9,
where ΔE is measured in electron volts (eV).
In computer graphics, it is not very efficient to simulate single photons; in-
stead large collections of them are simulated at the same time. If we take a very
large number of photons, each carrying a possibly different amount of energy,
531

i
i
i
i
i
i
i
i
532 21. Color
300 400 500 600 700 800 900
0
20
40
60
80
100
120
Relative Radiant Power
Figure 21.1. A spectrum describes how much energy is available at each wavelength λ,
here measured as relative radiant power. This specific spectrum represents average daylight.
then together they represent a spectrum. A spectrum can be thought of as a graph
where the number of photons is plotted against wavelength. Because two photons
of the same wavelength carry twice as much energy as a single photon of that
wavelength, this graph can also be seen as a plot of energy against wavelength.
An example of a spectrum is shown in Figure 21.1. The range of wavelengths to
which humans are sensitive is roughly between 380 and 800 nanometers (nm).
When simulating light, it would therefore be possible to trace rays that each
carry a spectrum. A renderer that accomplishes this is normally called a spectral
renderer. From preceding chapters it should be clear that we are not normally
going through the expense of building spectral renderers. Instead, we replace
spectra with representations that typically use red, green, and blue components.
The reason that this is possible at all has to do with human vision and will be
discussed later in this chapter.
Simulating light by tracing rays takes care of the physics of light, although it
should be noted that several properties of light, includingfor instance polarization,
diffraction, and interference, are not modeled in this manner.
At surface boundaries, we normally model what happens with light by means
of a reflectance function. These functions can be measured directly by means
of gonioreflectometers, leading to a large amount of tabled data, which can be
more compactly represented by various different functions. Nonetheless, these
reflectance functions are empirical in nature, i.e., they abstract away the chemistry
that happens when a photon is absorbed and re-emitted by an electron. Thus,
reflectance functions are useful for modeling in computer graphics, but do not
i
i
i
i
i
i
i
i
21.1. Colorimetry 533
offeran explanationas to why certain wavelengths of light are absorbed and others
are reflected. We can therefore not use reflectance functions to explain why the
light reflected off a banana has a spectral composition that appears to us as yellow.
For that, we would have to study molecular orbital theory, a topic beyond the
scope of this book.
Finally, when light reaches the retina, it is transcoded into electrical signals
that are propagated to the brain. A large part of the brain is devoted to processing
visual signals, part of which gives rise to the sensation of color. Thus, even if
we know the spectrum of light that is reflected off a banana, we do not know yet
why humans associate the term “yellow” with it. Moreover, as we will find out in
the remainder of this chapter, our perception of color is vastly more complicated
than it would seem at first glance. It changes with illumination, varies between
observers, and varies within an observer over time.
In other words, the spectrum of light coming off a banana is perceived in the
context of an environment. To predict how an observer perceives a “banana spec-
trum” requires knowledge of the environment that contains the banana as well as
the observer’s environment. In many instances, these two environments are the
same. However, when we are displaying a photograph of a banana on a moni-
tor, then these two environments will be different. As human visual perception
depends on the environment the observer is in, it may perceive the banana in the
photograph differently from how an observer directly looking at the banana would
perceive it. This has a significant impact on how we should deal with color and
illustrates the complexities associated with color.
To emphasize the crucial role that human vision plays, we only have to look
at the definition of color: “Color is the aspect of visual perception by which an
observer may distinguish differences between two structure-free fields of view of
the same size and shape, such as may be caused by differences in the spectral
composition of the radiant energy concerned in the observation” (Wyszecki &
Stiles, 2000). In essence, without a human observer there is no color.
Luckily, much of what we know about color can be quantified, so that we
can carry out computations to correct for the idiosyncrasies of human vision and
thereby display images that will appear to observers the way the designer of those
images intended. This chapter contains the theory and mathematics required to
do so.
21.1 Colorimetry
Colorimetry is the science of color measurement and description. Since color
is ultimately a human response, color measurement should begin with human
i
i
i
i
i
i
i
i
534 21. Color
observation. The photodetectors in the human retina consist of rods and cones.
The rods are highly sensitive and come into play in low light conditions. Under
normal lighting conditions, the cones are operational, mediating human vision.
There are three cone types and together they are primarily responsible for color
vision.
Although it may be possible to directly record the electrical output of cones
while some visual stimulus is being presented, such a procedure would be inva-
sive, while at the same time ignoring the sometimes substantial differences be-
tween observers. Moreover, much of the measurement of color was developed
well before such direct recording techniques were available.
The alternative is to measure color by means of measuring the human re-
sponse to patches of color. This leads to color matching experiments, which will
be described later in this section. Carrying out these experiments have resulted in
several standardized observers, which can be thought of as statistical approxima-
tions of actual human observers. First, however, we need to describe some of the
assumptions underlying the possibility of color matching, which are summarized
by Grassmann’s laws.
21.1.1 Grassmann’s Laws
Given that humans have three different cone types, the experimental laws of
color matching can be summed up as the trichromatic generalization (Wyszecki
& Stiles, 2000), which states that any color stimulus can be matched completely
with an additive mixture of three appropriately modulated color sources. This
feature of color is often used in practice, for instance by televisions and monitors
which reproduce many different colors by adding a mixture of red, green, and
blue light for each pixel. It is also the reason that renderers can be built using
only three values to describe each color.
The trichromatic generalization allows us to make color matches between any
given stimulus and an additive mixture of three other color stimuli. Grassmann
was the first to describe the algebraic rules to which color matching adheres. They
are known as Grassmann’s laws of additive color matching (Grassmann, 1853)
and are given here.
• Symmetry law. If color stimulus A matches color stimulus B,thenB
matches A.
• Transitive law. If A matches B and B matches C,thenA matches C.
• Proportionality law. If A matches B,thenαA matches αB,whereα is a
positive scale factor.
i
i
i
i
i
i
i
i
21.1. Colorimetry 535
• Additivity law. If A matches B, C matches D,andA+C matches B + D,
then it follows that A + D matches B + C.
The additivity law forms the basis for color matching and colorimetry as a
whole.
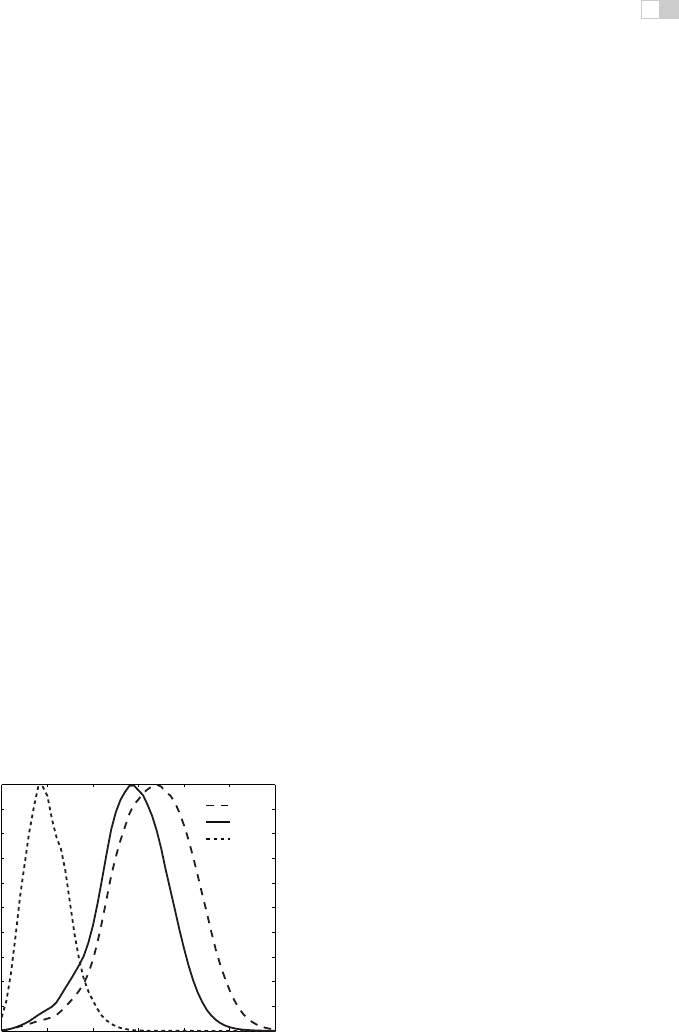
21.1.2 Cone Responses
Each cone type is sensitive to a range of wavelengths, spanning most of the full
visible range. However, sensitivity to wavelengths is not evenly distributed, but
contains a peak wavelength at which sensitivity is greatest. The location of this
peak wavelength is different for each cone type. The three cone types are clas-
sified as S, M, and L cones, where the letters stand for short, medium, and long,
indicating where in the visible spectrum the peak sensitivity is located.
The response of a given cone is then the magnitude of the electrical signal it
outputs, as a function of the spectrum of wavelengths incident upon the cone. The
cone response functions for each cone type as a function of wavelength λ are then
given by L(λ), M(λ),andS(λ). They are plotted in Figure 21.2.
The actual response to a stimulus with a given spectral composition Φ(λ) is
then given for each cone type by
L =
λ
Φ(λ) L(λ) dλ,
M =
λ
Φ(λ) M(λ) dλ,
S =
λ
Φ(λ) S(λ) dλ.
This triple of integrated responses are known as tristimulus values.
400 450 500 550 600 650 700
0.0
0.1
0.2
0.3
0.4
0.5
0.6
0.7
0.8
0.9
1.0
wavelength (nm)
sensitivity
L
M
S
Figure 21.2. The cone response functions for L, M, and S cones.
..................Content has been hidden....................
You can't read the all page of ebook, please click here login for view all page.