
PUTTING INFORMATION INTO A PROJECT IS FINE, but you put information into Microsoft Office Project 2007 so that you can get information out of project. You can use reports—and project comes with a boatload that you can read about in 9—but you don’t always need to print something to find the information you need. For example, when you want to focus on resource overallocations, there are a number of ways to look at your project data. This chapter describes seeing project information on-screen using views and tables, and filtering, sorting, and grouping project information to focus on particular aspects of it. I also cover using custom fields in Project; custom fields give you a great deal of flexibility in viewing and tracking information.
Using views, you can enter and organize information. You can also use views to examine information from various perspectives. For example, use task views when you want to focus on the tasks in your project, but when you start to evaluate resource allocations, use resource views.
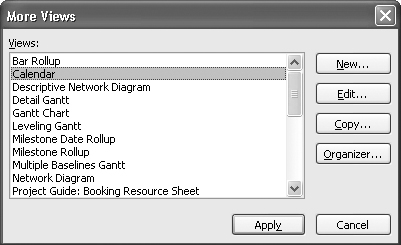
Project contains more than 27 standard views. To display any of them, on the View menu, click More Views. In the More Views window (see 4-1), select the view you want and click Apply.
It’s important to understand that each view focuses either on tasks or on resources. Some views, such as the Task Usage view and the Resource Usage view, combine information about tasks and resources, but each view has a primary focus. Understanding this concept will help you select the right view to get the information you need and will also help you understand custom fields, which also depend on the task orientation or resource orientation of a view. You can read more about custom fields later in this chapter, in the section "Using Custom Fields."
Note
The New button in the More Views window lets you create your own views. But I suggest you explore all of the standard views before you start creating your own views; the chances are quite good that you’ll find what you need without creating a new view.
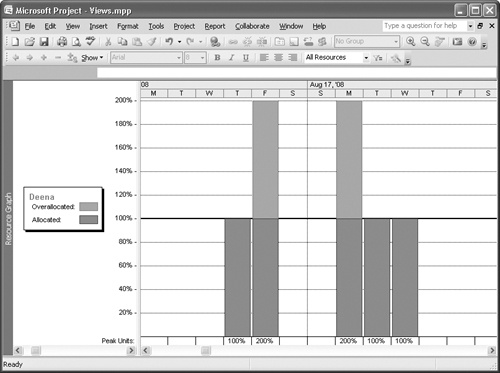
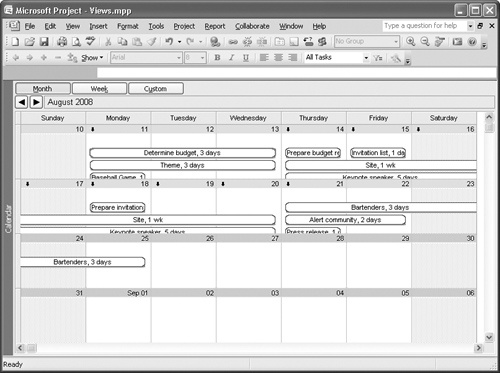
In addition to having either a task orientation or a resource orientation, views come in various flavors; for example, you’ll find picture views such as the Resource Graph view, which presents a resource’s allocation using a bar chart (see 4-2). The Calendar view, shown in 4-3, lays out tasks on a calendar, providing a visual representation of task duration against a familiar backdrop. The Network Diagram view also falls into this family of views, showing how your tasks connect to each other.
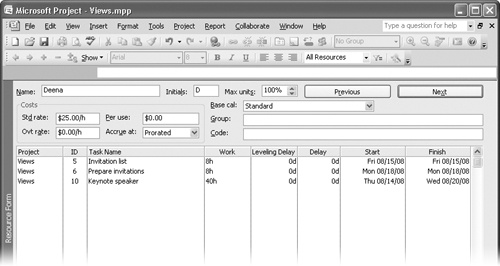
Form views present information about a single task or resource, and you can use them to view or edit information. The Resource Form view (see 4-4) shows the tasks to which one resource is assigned. When you display the Task Form view, you’ll see the information from the opposite perspective—for a single task, the view displays the resources assigned to the task.
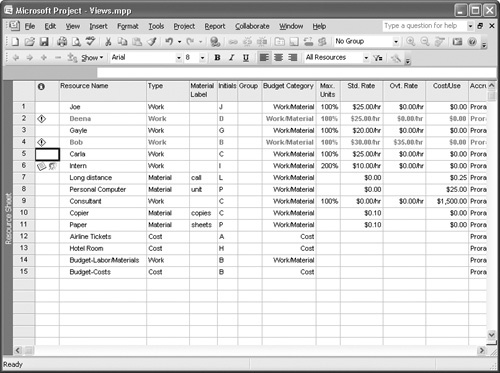
Sheet views, such as the Resource Sheet view or the Task Sheet view, present information in a table that includes a Name column that identifies the resource or task, and information about each resource or task appears across the rows (see 4-5). One sheet view can actually present a variety of information, depending on the table you select; see the section "Understanding Tables" later in this chapter for more information about tables.
The Gantt Chart view and its relatives—the Tracking Gantt, the Leveling Gantt, the Detailed Gantt, and the Multiple Baselines Gantt views—are views that display a table on the left side of the view and a picture-oriented view on the right side. The Resource Usage and Task Usage views are views that display a table on the left and a Details portion on the right that displays usage information—resource time or task duration—on a timescale, which displays daily information by default, but you can change the timescale to display information over weeks or months.
Tip
You can change the timescales used in the usage views and the various Gantt Chart views by right-clicking the timescale and clicking timescale.
While the Gantt Chart views and the usage views are views that combine a table and some other type of view, project officially considers the views that appear when you use the Split command (on the Window menu) as combination views, which display one view in the top pane of the window and either the Task Form view or the Resource Form view in the bottom pane. The form view that project displays in the bottom pane depends on the view you displayed before you split the window. If you display a task-oriented view, such as the Gantt Chart view, and then split the window, project displays the Task Form view. If you display a resource-oriented view, such as the Resource Graph view, and then split the window, project displays the Resource Form view.
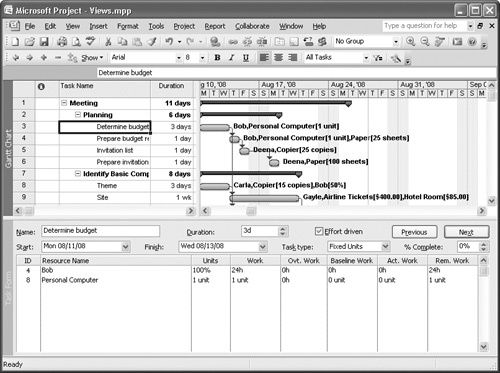
Start in the Gantt Chart view, and on the Window menu, click Split. Project displays the task Form view in the bottom of the window. When you work in a combination view, whatever you select in the top portion of the view controls the information project displays in the bottom portion of the view. So, as shown in 4-6, the Task Form view in the bottom of the window displays the details of the resources assigned to the task appearing on Row 3 of the Gantt Chart view in the top portion of the window.
You can use the Split bar to split any view and to remove the split. In a view that doesn’t contain a split, the Split bar appears as a small, flat, horizontal bar just below the vertical scroll bar arrow on the right side of the window. When you move the mouse pointer over the Split bar, the mouse pointer appears as a pair of parallel horizontal lines with arrows pointing up and down. Drag the Split bar up to create a split view. In a view you’ve already split, the Split bar runs horizontally across the entire window and separates the top view from the bottom view. Drag the Split bar down to remove a split view.![]()
You can work in either view by clicking that view. You also can change the view that appears in either pane by clicking that pane and then selecting a different view—which is the true distinction between a combination view and a view like the Gantt Chart or the Resource Usage view. In the Gantt Chart view or the Resource Usage view, you can display different tables on the left, but you cannot select a different view to appear on the left or right side of the screen.
When you finish working in a combination view like the one shown in 4-5, you can, on the Window menu, click Remove Split. Project always hides the view that appears in the bottom portion of the window.