
When you finally reach a plan you want to execute, your last step in the planning phase should be to create a baseline for your project. A baseline is a snapshot of your project at a moment in time. In a baseline plan, Project stores start and finish dates, duration, work, and cost information about tasks, resources, and assignments. You can use this information later, to compare your original estimates to what actually happens as you execute your project. By making this comparison, you can be alert for shifts in timing. Good project managers use these comparisons to become better project managers in the future by learning what worked and what didn’t work. Interim plans are similar to baselines, but they contain less information. Because Project stores only a set of task start and finish dates in an interim plan, you can use interim plans for comparisons concerning progress or slippage but not duration, work, or cost information.
You can set up to 11 baselines in a project; typically, you set a baseline at the end of the planning phase before you start recording information about what actually happens as you execute your project plan. You might also want to set additional baselines as you complete each phase of your project or as you reach milestones.
Warning
Just because you can save 11 baselines doesn’t mean you should. Saving baselines increases the size of your Project file because Project adds a set of fields to your project file to store each baseline’s information. Saving lots of baselines can slow down Project’s calculation of your schedule and make the analysis work confusing and more difficult.
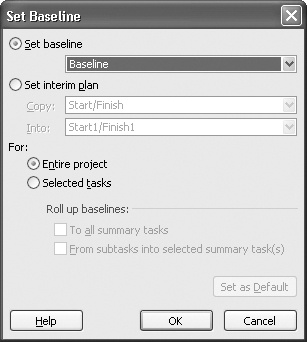
To set a baseline, save your project. Then on the Tools menu, point to Tracking, and click Set Baseline to display the Set Baseline dialog box (see 8-10). Click the Set Baseline option and in the Set Baseline list, click the baseline that you want to set. Click OK, and Project creates the baseline information.
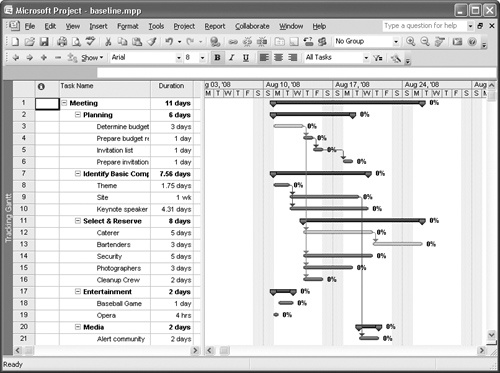
When you save your project, Project saves the baseline information along with the rest of your project information. 8-11 shows the Tracking Gantt view of a project before setting the baseline. Notice that each Gantt bar is only a single bar. 8-12 shows the same project after setting a baseline. The bottom bar of each task represents the baseline information and the top bar represents the actual information.

You save interim plans the same way that you set a baseline; in the Set Baseline dialog box, select the Set Interim Plan option. Then identify the start and finish dates you want to copy; you can copy start and finish dates from any of the baselines you created, from the current plan, or from any of the interim plans you created. You then select the fields into which you want to copy the information. For example, you might copy Start and Finish into Start1 and Finish1 for your first interim plan. Later, you can copy Start and Finish into Start2 and Finish2 to create another interim plan.
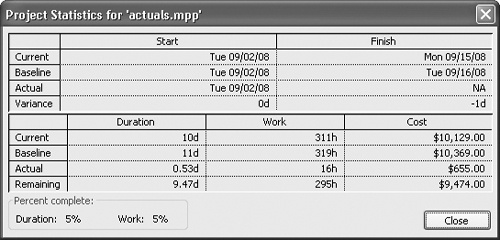
To analyze baseline and actual information for your project, you can use the Project Statistics window. On the Project menu, click Project Information, and then click the Statistics button (see 8-13). This window helps you compare overall baseline information stored in the Baseline fields to overall actual information you’ve recorded.
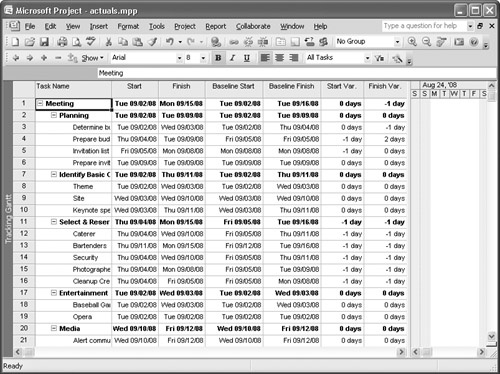
You also can compare baseline and actual information in more detail using the Variance table of any task-oriented view that contains a table. Right-click the Select All button in the table and click Variance. The Variance table, shown in 8-14, shows baseline and scheduled fields by default; you can add other baseline fields to the table if you want.
Using the Tracking Gantt view, shown earlier in 8-11, you also can compare what you planned with what’s happening in the project.
Note
In 8-11, no progress had yet been recorded.
If you set multiple baselines, you can view them using the Multiple Baselines Gantt view (on the View menu, click More Views. In the More Views window that appears, click Multiple Baselines Gantt and then click Apply). From this view, you can see Baseline, Baseline1, and Baseline2 information. To view information from other baselines, use the Bar Styles dialog box (on the Format menu, click Bar Styles) to add additional baseline fields to the view.