
AS YOU MOVE toward finalizing your plan and get ready to begin the "implementation stage" of your project, it’s always wise to step back and review what you’ve got in your plan. As you work on this finalization of the project plan, you want to review the project’s scope to make sure that the scope hasn’t changed. You also want to review the project schedule from a variety of views, making sure you’ve addressed all possible concerns. You want to determine the critical path of the project plan so that you can keep a close eye on tasks on the critical path. Finally, you want to set a baseline for the plan so that later, after you’ve completed the plan, you can compare your estimates to what actually happened; this type of review helps you identify where your estimates were inaccurate so that you can improve your estimating skills for the next project.
When you reach the final stages of the planning phase of a project, you want to review the project plan from a variety of perspectives. This review can help you determine whether you think you can implement the plan on time and within budget. In 4, you will learn how to change views and change tables in views. You also can find information there on adding and removing information from tables in views.
While working with Microsoft Office Project 2007, it’s not uncommon to spend a great deal of time in the Gantt Chart view, shown in 8-1. The Gantt Chart view provides a visual representation of the timing of your tasks along with a variety of tables that help you review different types of information.

The Relationship Diagram view, shown in 8-2, is exceedingly helpful when you want to study task dependencies. Like the Network Diagram view, which also helps you study task relationships, this view has no table. Unlike the Network Diagram view, which does contain some task information such as start and end dates, duration, and resources assigned, the relationship Diagram view has no distractions from the purpose of examining the relationships of tasks in your project. You select any task in your project, and the Relationship Diagram view shows you the task’s ID, predecessor tasks, successor tasks, and the type of dependency that exists between tasks. Using this view, you might find a dependency you created that you don’t need, or a dependency that you need but didn’t create, or even a dependency of the wrong type.
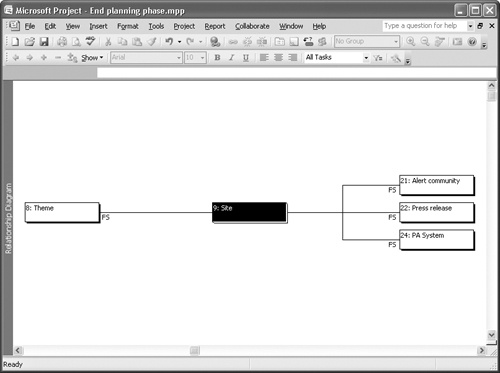
Figure 8-2. The Relationship Diagram view helps you study the dependencies you’ve created between tasks.
As you read in 6, the Resource Graph view and the Resource Allocation view are both helpful when you are trying to find and resolve resource overallocations. The Resource Form view shows you not only the tasks to which any particular resource is assigned; you also see the resource’s rate, maximum units, and calendar information, all on a single page (see 8-3).
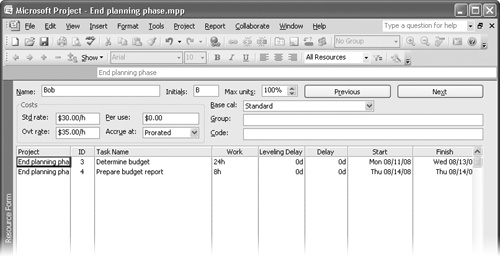
Figure 8-3. The Resource Form view shows you tasks for a resource, along with resource-specific information.
Tables are typically more helpful when you want to review costs on-screen, and the Cost table shows you just about everything you might want to know about costs during the planning phase of your project. You can view the Cost table from any view that has a table associated with it. If you start in a task-oriented view, and then apply the Cost table by right-clicking the Select All button and clicking Cost, Project displays the costs associated with each task. If you start from a resource-oriented view such as the Resource Sheet view, and apply the Cost table, Project displays your project’s costs as they are associated with each resource. If you view costs from a usage view, such as the Resource Usage view shown in 8-4, and apply the Cost table, Project breaks down the costs both by task and by resource.
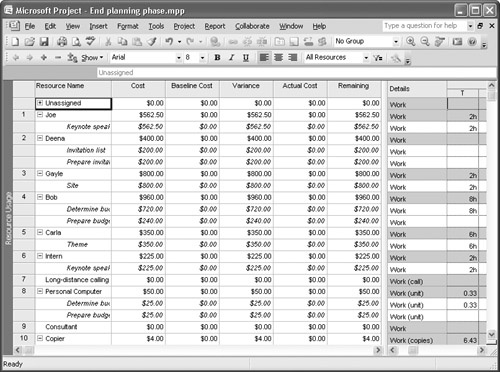
Note
During the planning phase, the baseline cost and the actual cost are zero. Before you start tracking, you’ll set a baseline as described later in this chapter. When you begin implementing your plan, you’ll capture the actual costs and be able to make comparisons between planned costs and actual costs.
Note
It’s important to understand that the Cost table shows different fields for task-oriented views and resource-oriented views. You can see fixed costs and their effects on your project only from the Cost table in task-oriented views.
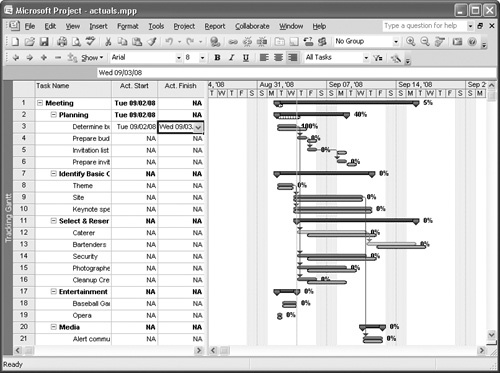
When you start tracking what really happens after you begin work on your project, as described in 10, you’ll probably use the Tracking Gantt view most often. From this view, you can enter information about when tasks actually start and end, actual duration information, and actual work information. The Tracking Gantt view (see 8-5) demonstrates visually where you stand in reality compared to the baseline project plan that shows where you thought you’d be.