
Reporting is one of the most common ways of communicating project information. Project contains reports containing numbers, and if you have Excel and Visio, you can also produce visual reports. But before you dive into producing reports, you might want to do a little planning.
Project supports two kinds of numbering schemes you can assign to tasks to help you quickly and easily identify the task’s position in the hierarchy of your project: outline numbers and field codes, and WBS codes. Because you might want to include a numbering scheme to make discussion about tasks in your project easier, you might want to set up your project to include one or both of these numbering schemes.
Project enables you to use automatic outline numbering or outline field codes to number your tasks. Using outline numbers, you can’t edit the outline numbers. You must simply accept the outline numbers Project assigns. If you want more control over how Project displays your outline numbers, use outline field codes.
The outline numbering system that Project uses closely resembles the numbering system you find in most legal documents. In a legal document, major headings are preceded by a whole number. Subordinate headings include the major heading’s whole number, a period, and then a subordinate paragraph number. So the fourth major heading is numbered 4.0 (or just 4), and the third paragraph under the second major heading is numbered as 2.3.
When you display outline numbers in Project, you’ll find that Project assigns whole numbers to tasks that are not indented, and Project assigns to subtasks numbers that start with their summary task’s number. The actual number Project assigns to a subtask depends on how many times the subtask is indented from the left edge of the outline.
To display outline numbers, follow these steps:
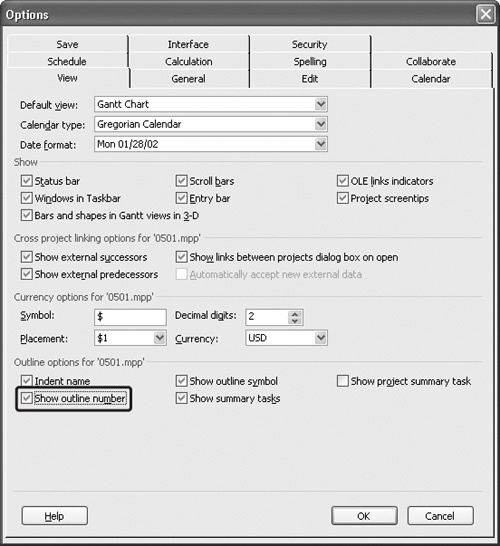
While viewing any task-oriented view containing a table, on the Tools menu, click Options to display the Options dialog box.
Click the View tab.
Select the Show Outline Number check box:
Click OK.
Project displays outline numbers to the left of each task name (see 9-3). The outline number Project assigns to a task depends on how much you have indented the task and the position of the task in the hierarchy.
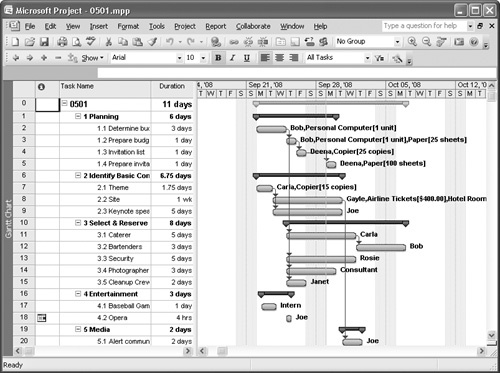
Because the numbers Project assigns to each task depend on its position in the schedule, when you move a subtask in the outline, delete a task, or insert a task, Project renumbers all affected tasks. So if you move the third subtask in the first group of tasks so that it becomes the second subtask in the second group of tasks, Project renumbers the subtask you moved to 2.2; Project also renumbers all subtasks in the first group that appeared below the task you moved and all subtasks in the second group that appear below the new task you added to the group.
Suppose that your organization has developed accounting codes that use an outline format and you want to assign these codes to the tasks in your project so that your tasks reflect the way that your organization does business. You can use a custom outline code field to create your accounting codes and assign them to each task.
Note
You don’t need to choose between using automatic outline numbers and using custom outline codes—you can assign both to your tasks.
Outline codes don’t depend on the structure of your project outline or on the number of times a task is indented. But outline codes can work in a hierarchical fashion. You create the hierarchy when you define the outline code, by establishing codes at the highest level and additional codes at various subordinate levels. Although Project won’t limit you, don’t define too many subordinate levels of outline codes because they simply become harder to use.
In addition to not relying on the structure of your project outline or the number of times a task is indented, outline codes differ from outline numbering in a few ways:
You can control the form of outline codes but not the form of Project’s automatic outline numbers.
Outline codes are not tied to the hierarchical structure of your project like outline numbers are, but you can set up outline codes to use a hierarchical structure that you define.
Outline numbers and outline codes behave differently when you move a task. When you use outline numbers, Project renumbers all affected tasks if you move, delete, or insert a task. If you use outline codes, the letters and numbers you assign are static, and Project doesn’t renumber outline codes when you move, delete, or insert tasks.
You can enter outline code information randomly, but most people prefer to create a list of valid outline codes that Project displays as you assign codes to the tasks in your project. That way, the outline codes you assign to tasks are both consistent and meaningful.
Defining and using custom outline codes involves five major steps:
Select one of Project’s 10 outline codes to customize.
Define the appearance of each portion of the code by setting up a code mask.
Set up a lookup table that contains the valid values for the outline code that you can assign to tasks.
Display the outline code field in your project.
Assign the appropriate outline code value to each task in your project.
Follow these steps to select and rename an outline code, establish its appearance, and create a lookup table of valid values for it:
On the Tools menu, point to Customize, and click Fields to display the Custom Fields dialog box.
In the Type list, click Outline Code:
From the list of outline code fields, select one to customize.
Click the Rename button and type the new name for the outline code—one that will help you remember its purpose. Then click OK to redisplay the Custom Fields dialog box.
Click the Lookup button to display the Edit Lookup Table dialog box.
Click the plus sign (+) beside Code Mask to change it to a minus sign (–) and display the top portion of the Edit Lookup Table dialog box.
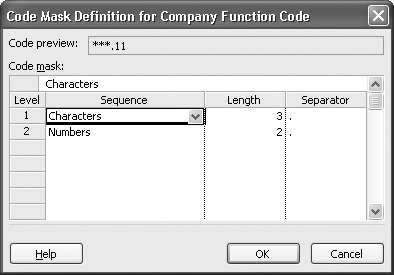
Click the Edit Mask button to display the Code Mask Definition dialog box:
In the list in the Sequence column, select whether the first part of the outline code should be numbers, uppercase or lowercase letters, or characters—a combination of uppercase or lowercase letters and numbers. If you choose Characters, Project initially displays asterisks for that part of the code mask in the Code Preview box, indicating that you can replace those asterisks with any characters that you want when you define values in the lookup table.
In the list in the Length column, specify a length for the first portion of the outline code.
In the list in the Separator column, select a character to separate the parts of your outline code. You can choose a period (.), dash (–), plus sign (+), or slash (/), or you can type in any character that is not a number or a letter (such as =).
Repeat steps 8 through 10 for each level you want to define in your outline code.
Click OK to redisplay the Edit Lookup Table dialog box.
Click the plus sign (+) beside Lookup Table, and Project expands the Edit Lookup Table dialog box so that you can define lookup table values.
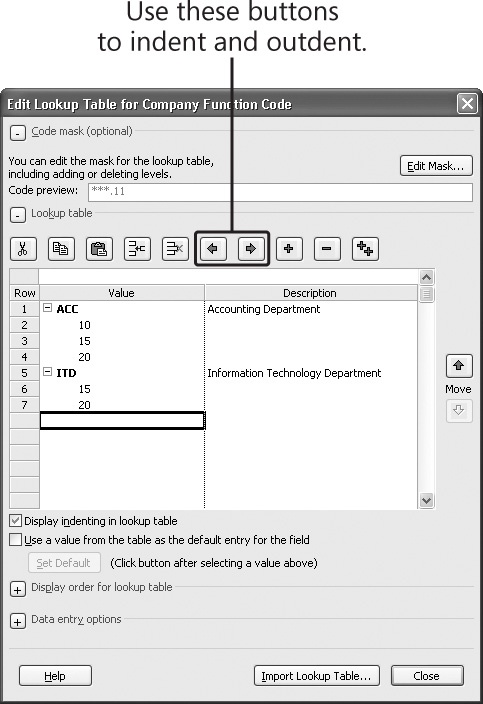
In the first row of the Value column, type a permissible value for the first level of your outline code and press Enter. Optionally, you can type an explanation of the value in the Description column.
In the second row of the Value column, type an outline code for the second level that is permissible under the first level and press Enter.
Move the pointer back into the second row and click the Indent button to indent the value so that it appears indented under the first outline level.
Repeat steps 15 and 16 to establish additional values indented under the first outline level. You can create values indented to the third level using the same technique.
Click Close to redisplay the Custom Fields dialog box.
Click OK to save your outline code settings.

Now you’re ready to display and enter your outline codes. To display the outline code, switch to a task-oriented view that contains a table, such as the Gantt Chart view. Click in the column that you want to appear to the right of the outline code and on the Insert menu, click Column. In the Field Name list, click the outline code that you just created; Project still displays Outline Code1 in the Field Name list, but the name you assigned to the code appears in parentheses (see 9-4).

Click OK, and Project displays the column in the table. To enter values for the outline code, click in the outline code column. From the list that Project displays, you can select one of the entries you defined in the lookup table (see 9-5).

WBS codes provide another way to organize tasks in a project. These codes help identify the tasks in a project based on the phase in which the task occurs. WBS stands for work breakdown structure, and these codes were originally developed by the U.S. defense establishment.
The typical WBS chart would probably remind you of a company organization chart with boxes that organize tasks hierarchically. Each box contains the task’s name along with a number that identifies the phase in which the task occurs and the phase’s hierarchical relationship in the project; for example, the fourth task in the second phase of the project would have a WBS code of 2.4.
Project doesn’t produce a WBS chart, but you can assign WBS codes to the tasks in your project.
Project automatically assigns WBS codes that look like outline numbers to the tasks in your project; you simply need to display the WBS field to see them. Switch to a task-oriented view that contains a table, such as the Gantt Chart view. Click in the column that you want to appear to the right of the WBS code and on the Insert menu, click Column. In the Field Name list, click WBS, and click OK.
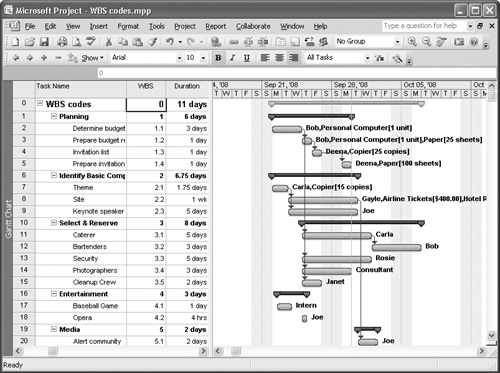
Project displays the WBS codes assigned to tasks in your project based on their position in the project outline (see 9-6); a task with a WBS code of 1.4 is the fourth task in the first phase of the project. Whole numbers identify phases of the project.
Often, the default WBS numbers are all you need, but occasionally you might need to modify the appearance of the WBS code. For example, you might want to incorporate information that is meaningful to you and your client, such as the project name or a client number as a prefix for the WBS code. And you may want to include letters in the WBS code along with numbers.
You can customize the WBS codes that Project assigns by establishing your own code mask; like the code mask for outline numbers, the code mask for WBS codes defines the appearance of the code. When you define the code mask, you can use sequential numbers, uppercase or lowercase letters in alphabetical order, or numbers or letters in no order.
To create your own custom WBS codes, follow these steps:
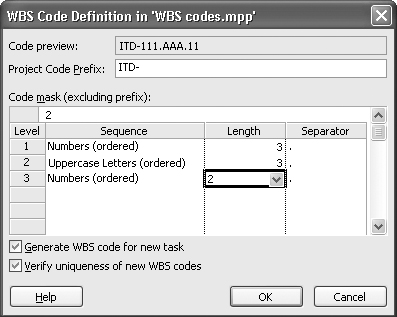
On the Project menu, point to WBS, and click Define Code to display the WBS Code Definition dialog box:
In the Project Code Prefix box, type any prefix that you want to appear at the beginning of all WBS codes, such as the initials of the project name or a client number.
Click the first blank row in the Sequence column to display an arrow, and select the type of character that you want to use for the first part of the WBS code.
In the Length column, identify a length for that portion of the WBS code.
Note
For length, you can choose Any or a number between 1 and 10. If you choose 4 for the first level of your WBS code, the WBS code for all tasks in the first phase of your project will begin with your project code prefix followed by 0001 and the WBS code for all tasks in the second phase of your project will begin with your project code prefix followed by 0002.
In the Separator column, select a character to separate the parts of your WBS code. You can choose period (.), dash (–), plus sign (+), or slash (/), or you can type any character that is not a number or a letter (such as =).
Repeat steps 3 through 5 for each level in your outline.
Click OK to save your customized WBS code.
If you have already displayed the WBS field, Project updates the field with your newly designed WBS codes (see 9-7).
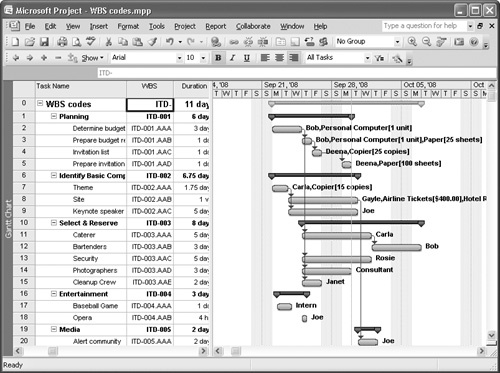
Figure 9-7. Use a customized WBS code to include information that describes a task’s hierarchical position in the project outline.
Project’s treatment of WBS code numbers changes, depending on whether you use the default WBS codes or customized WBS codes. If you use the default WBS codes that Project inserts without customizing them, Project renumbers affected WBS codes automatically if you move, insert, or delete a task.
If you use a custom code mask for WBS codes, Project doesn’t automatically renumber when you move, insert, or delete a task. Project behaves this way because there are circumstances under which you don’t want to renumber the WBS codes in your project.
Suppose, though, that you want to renumber tasks that use a customized WBS code. On the Project menu, point to WBS, and click Renumber. Project displays the WBS Renumber dialog box. Click OK, and Project renumbers the WBS codes in the project schedule. If you want to renumber the WBS codes for only some tasks, select those tasks before you open the WBS Renumber dialog box. Project then offers you the option of renumbering only the selected tasks or the entire project.
Reports are an essential part of communication, providing information on paper that people can study and evaluate. You’ll want to make sure that you review reports from Project so that you can ensure that the information in your project schedule accurately reflects the way things will happen.
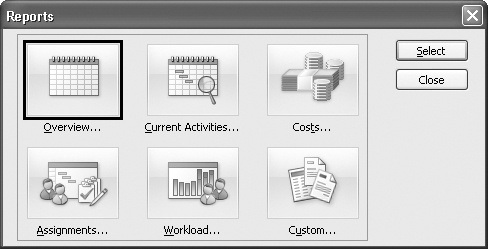
You can print your Gantt chart and your Network Diagram and any other view you want by displaying that view; then on the File menu, click Print. Project also contains some standard reports that contain numbers in rows and columns primarily. To print any of the standard reports, on the Report menu, click Reports, and Project displays the Reports window shown in 9-8.
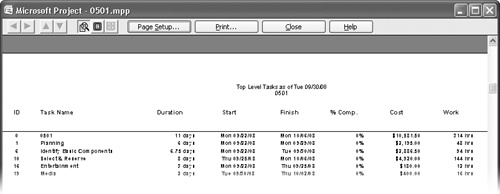
Once you select a category, Project shows you the reports available in that category. 9-9 shows the Top Level Tasks report from the Overview category, which helps you focus on "the big picture" by displaying information about the tasks that typically represent phases in your project. This report shows you the duration, start and finish dates, percentage complete, cost, and work for each of those tasks.
Each of the report categories provides reports that should be of interest to you. For example, also in the Overview category, you’ll find a Critical Tasks report that singles out critical tasks, providing you with their duration, start and finish dates, predecessors, and successors. The Current Activities category provides you with reports that list tasks that haven’t started, will start soon, are in progress, are completed, should have started, and are slipping from their anticipated ending dates. I recommend that you print each report for one project so that you can study the information provided on the report.
You can use the Custom category to print a variety of predefined reports such as the Base Calendar report. You also can edit any of the standard reports to customize them or create reports of your own.
Visual reports use the numbers in your project schedule to create charts and graphs. Visual presentation is often helpful when trying to drive home a point. To use the visual reports available in Project, you need to install Excel 2007, Visio 2007, or both.
Project produces visual reports using a collection of Excel and Visio templates that use project information to produce workbooks that contain Excel PivotTables and Excel PivotCharts and files that contain Visio PivotDiagrams. Because the report information appears in Excel and Visio files, you can modify the report without affecting any data stored in your project schedule.
For those who are wondering, you don’t need to start Excel or Visio before you produce a visual report in Project. Regardless of the visual report you choose to produce, follow these steps:
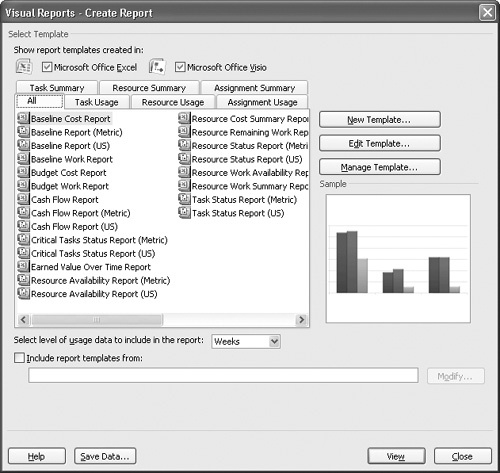
In the Project schedule on which you want to report, on the Report menu, click Visual Reports to display the Visual Reports – Create Report window:
The All tab displays all available visual reports; you can click the tab containing the type of report you want to produce to narrow your choices.
Click View. Project displays the report in the appropriate program—Excel or Visio.
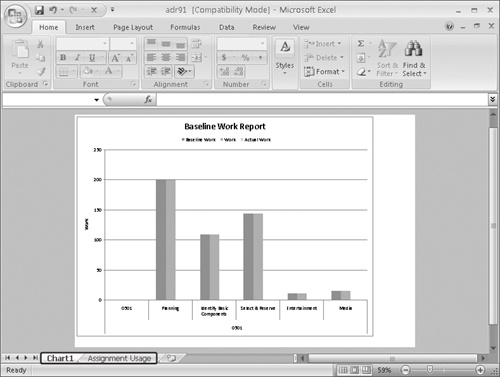
In a typical Excel-based visual report, you initially see the PivotChart Excel prepares using the project’s data, but the workbook actually contains two tabs (see 9-10).
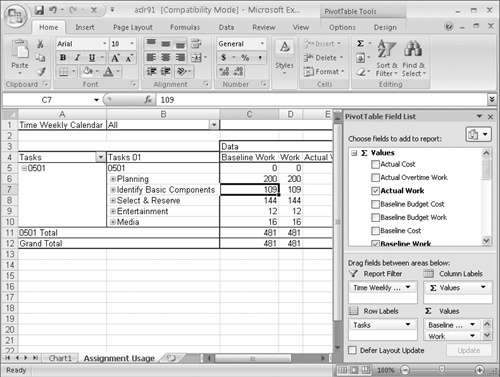
The second tab contains the PivotTable on which the PivotChart was created (see 9-11). Using the PivotTable Field List at the right side of the screen, you can change the information that appears in the chart. For example, you can control the fields that appear in the report by checking or removing checks from fields in the top portion of the pane. Use the information in the lower portion of the pane to rearrange the information in the chart. You also can filter the information that appears on the report using any lists that appear in the table.
Typical Visio-based visual reports are PivotDiagrams; I selected the Task Status report for the PivotDiagram shown in 9-12 because, with a little fiddling in Visio, I can make this PivotDiagram into a WBS chart.

Tip
Initially, the PivotDiagram displays only top-level tasks that represent phases. You can display subordinate tasks by clicking each top-level task and then clicking Tasks in the Add Category portion of the pane on the left side of the screen.
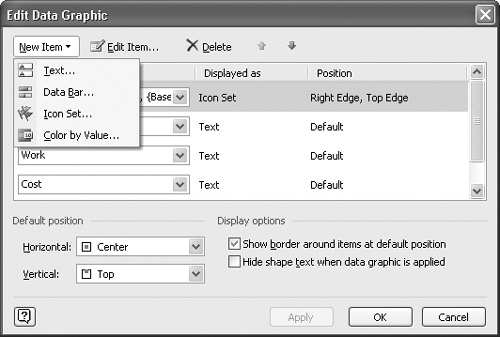
To make this report into a WBS chart, add a new field in each box on the visual report; in the box, display the WBS number associated with the task. Right-click any box representing a task on the report, point to Data, and click Edit Data Graphic. In the Edit Data Graphic dialog box (see 9-13), click New Item and click Text.
In the New Text dialog box (see 9-14), in the Data Field list, click WBS.
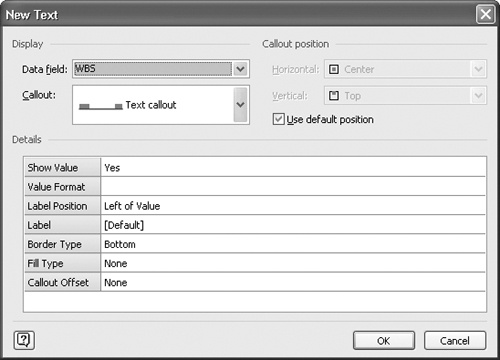
Click OK twice to redisplay the Visio PivotDiagram. Each task on the diagram will now display a WBS code.