
PLANS ARE, WELL, PLANS. After you record progress, you’ll need to evaluate your plan to determine how closely it matches reality. In some cases, reality might be better—you might be ahead of schedule, under budget, or both. But in other cases, you might find that you’re behind schedule, over budget, or both. So what do you do? In this chapter, we’ll first explore ways for you to determine how reality compares to your plan. Then we’ll look at approaches you can take to try to get back on track.
Once you start recording progress information using Microsoft Office Project 2007, you can review the progress of your project. The Tracking Gantt view, shown in 12-1, provides the most effective picture showing where your project stands.
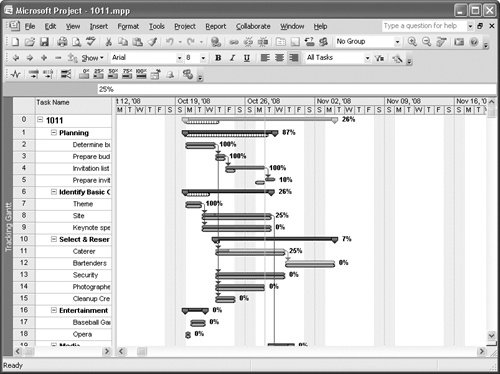
The bottom bar of each row on the chart portion of the view, which appears as black hatching on your screen, represents the baseline dates for each task. The top bar represents either the planned start and finish dates or, if a task has been completed, the actual start and finish dates for each task.
The formatting of the top task bars in the Tracking Gantt view indicates each task’s status. Interpret the formatting of the top task bars in the following ways:
If the top bar of a task is blue, the task is not on the critical path; if the task is on the critical path, the top bar appears red. The percent complete appears on the right side of the top bar of every task.
There appears to be no difference in the solid blue task bar appearing on top of a non-critical completed task and a non-critical task that hasn’t yet started. If you look closely at a non-critical task that is partially complete, you’ll notice that a small mark in the bar separates the completed portion from the uncompleted portion.
For partially completed tasks on the critical path, the completed portion appears darker red than the uncompleted portion, and the distinction between the completed and uncompleted portion is easy to see. If the task is complete, the bar appears solid red.
While you’re in the Tracking Gantt view, switch to the Work table (see 12-2) by right-clicking the Select All button and clicking Work on the shortcut menu that appears. The Work table for tasks shows the total effort that is required from all resources to complete the task. And the Work table for tasks includes baseline information so that you can compare your progress to your original estimate.
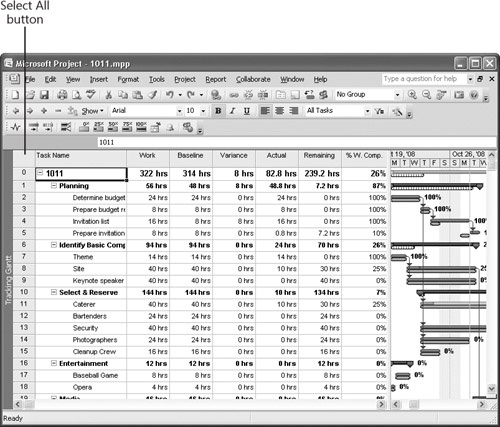
Work differs from task duration because work measures how many hours of effort are needed to complete a task, while task duration measures the amount of working time (for example, number of days) that is allotted to the task. Suppose that you’ve assigned two resources to a task that requires 48 hours of total work. Further suppose that the task duration is only two days. In this case, you need to extend the task’s duration, or if the task is effort-driven, you can add two more resources to complete the task in the specified duration.
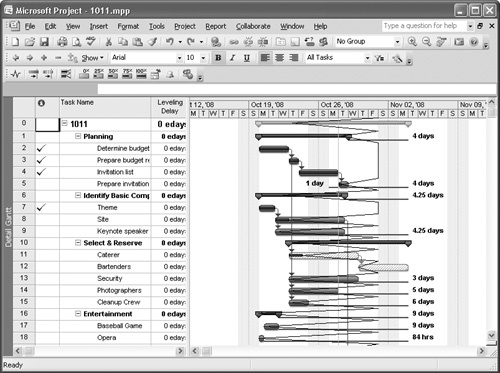
Assuming that you have saved a baseline for your project, you can add progress lines to any Gantt view of your project, such as the Gantt Chart view, the Tracking Gantt Chart view, and the Detail Gantt view. In 12-3, I added a progress line to the Detail Gantt view. Project draws a line that connects tasks that are either in progress or should be in progress, and the lines indicate what the progress should be relative to either the current date or the status date. The lines pointing to the right of tasks represent work that is ahead of schedule as of the progress line date, and lines pointing to the left of tasks represent work that is behind schedule.
To add a progress line, display the Gantt view to which you want to add progress lines, and then follow these steps:
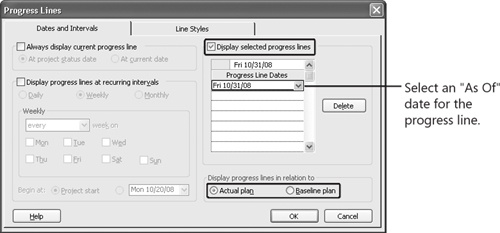
On the Tools menu, point to Tracking, and click Progress Lines to open the Progress Lines dialog box.
On the right side of the Dates And Intervals tab, select the Display Selected Progress Lines check box. Project makes the Progress Line Dates list available.
Click in the Progress Line Dates list to display a list box arrow.
Click the list box arrow to display a small calendar and select an "as of" date for the progress line.
At the bottom of the box, select either Actual Plan or Baseline Plan.
Click OK, and Project adds the progress line to the selected view.
As you can imagine, a progress line on a project with a large number of tasks can begin to look messy. But if you decide that you like progress lines, you can display them at varying intervals. You also can add specific dates to the Progress Line Dates list on the right side of the Progress Lines dialog box to display multiple progress lines on any Gantt view. If you decide to display more than one progress line, you might want to use the Line Styles tab of the Progress Lines dialog box to format the lines so that you can tell them apart. For example, you can set different colors for different lines.
Note
The options are limited; you can set one style for the Current progress line (the one identified in the Always Display Current Progress Line area of the Progress Lines dialog box), and one style for the other progress lines displayed.
To stop displaying progress lines, reopen the Progress Lines dialog box and clear any check boxes on the Dates And Intervals tab.