In 4, I discussed among other things the concepts of views and how they help you as you work in Project. When you’re trying to evaluate resource information and resolve resource conflicts, certain resource views can help you identify conflicts.
The Resource Graph view displays a vivid representation of each resource’s allocation (see 6-2) and makes it easy for you to find overallocated resources. Each vertical bar represents a resource’s allocation percentage on a particular day, based on the working hours for the resource. There’s a thick horizontal line that represents the 100% allocation mark. The bars below that line are blue and indicate 100 percent or less allocation. The bars above the line are red and indicate that the resource is overallocated and by what percentage. You also see the resource’s total allocation for any given day at the bottom of that day’s bar on the row labeled Peak Units. Any overallocated resource’s name appears in bold red letters.
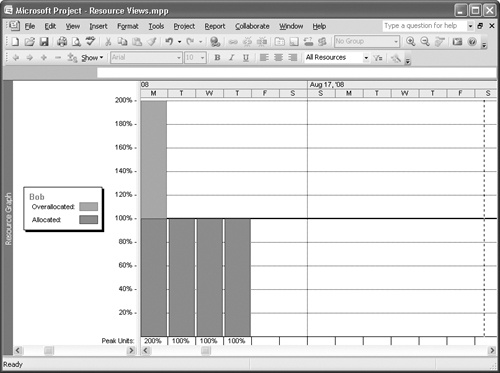
You view resources one at a time in this view; press the Page Down key or Page Up key to scroll through your resources. Use the scroll bar across the bottom of the right side of the view to display the resource’s allocation over time.
The Resource Allocation view consists of two panes and combines a Gantt chart in the lower pane with the Resource Usage view in the upper pane. Using this view, you can see the allocated work hours in the upper pane and simultaneously use the visual representation provided by the Gantt task bars to see the task timing and dependencies. If you select a resource in the upper pane, Project displays the tasks assigned to that resource in the Gantt Chart view that appears in the lower pane. Tasks that start at the same time overlap in the Gantt Chart pane, helping you to pinpoint the tasks that are causing the resource’s overallocation. In 6-3, Bob is overallocated on Thursday, August 14; he’s scheduled to work 16 hours that day. When you examine the Gantt Chart view in the lower pane, you’ll notice that Bob is assigned to work on two tasks that overlap on that day.
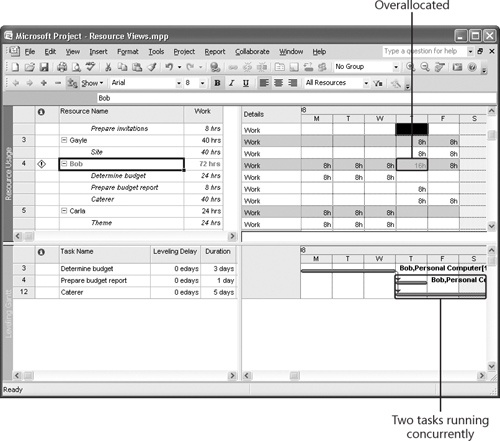
Figure 6-3. You can use the Resource Allocation view to help you spot and track down overallocations.
The top pane of the Resource Allocation view provides a few other clues that help you find overallocations: the names of overallocated resources appear in bold red type and a Caution icon appears in the Indicators column beside their names.
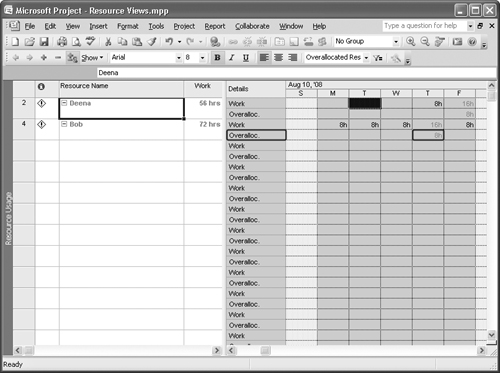
In the Resource Usage view, the names of overallocated resources appear in bold red type and a Caution icon appears in the Indicator column beside their names. If you move the mouse over the Caution icon, you can see a message about the overallocation.
You can filter this view to display only overallocated resources and then modify the view to display the extent of each resource’s overallocation. The names of overallocated resources appear in bold red type, and overallocated hours appear in red type. Follow these steps:
On the View menu, click Resource Usage to display the view.
In the Filter list on the Formatting toolbar, click Overallocated Resources to display only those resources that are overallocated:
To determine the amount of each overallocation, on the Format menu, point to Details, and click Overallocation. Project adds a row to the timescale portion of the Resource Usage view to show you the number of hours that you need to eliminate to correct the overallocation: