Consider using the Network Diagram to help you explain the flow of work to management. A Network Diagram presents your project much like a map for a road trip. Using the Network Diagram, you can determine how long the trip will take, identify potential bottlenecks, and find alternate ways to reach the destination.
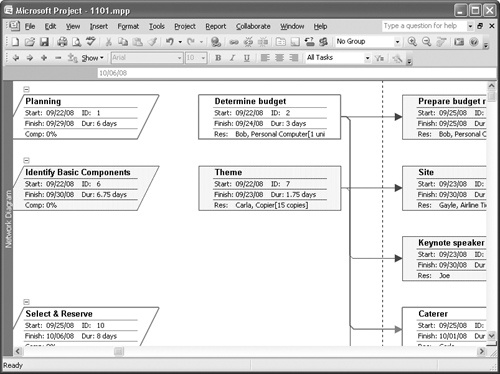
The Network Diagram (see 11-1) organizes the flow of project work using boxes that represent tasks. The lines and arrows that connect these boxes identify the sequence of tasks. To some degree, the lines and arrows also identify dependencies, because tasks on the left side of an arrow must occur before tasks on the right side of an arrow. That said, actual dependency relationships don’t appear by default on the Network Diagram. There is no timescale on the Network Diagram because the focus of the view is workflow rather than timing. Tasks on the left side of the diagram happen earlier in the project than tasks on the right side of the diagram. The Network Diagram aligns vertically all tasks that happen in the same timeframe. Summary tasks appear in angled boxes while subtasks appear in square boxes and to the right of their summary task. Tasks on the critical path appear in red boxes with bold outlines while tasks not on the critical path appear in blue boxes. Each box also contains the task’s projected start and finish dates. In-progress tasks have one half of an X through them, and completed tasks have a full X through them.
When using a Network Diagram, remember:
After you complete a task, you can proceed to the next task indicated by the arrow leaving the task you completed.
Before you can start a task, you must have completed all the tasks with arrows pointing to the task you want to start.
You need to put these two facts together to correctly interpret a Network Diagram. The first bullet says that you can proceed—it doesn’t say you must proceed to the next task. So you can work on a different task. But the second bullet limits the tasks available for work, because you cannot work on a task that has uncompleted tasks pointing to it.
You can control much of the appearance of Project’s Network Diagram to help you make your case. You can control the way Project lays out the Network Diagram and links boxes together. You also can control the shape, color, and line style of Network Diagram boxes, as well as the information that appears in the boxes.
You can use the Network Diagram toolbar to make many of these changes. To view this toolbar, right-click any toolbar and then click Network Diagram.
The facets of the Network Diagram layout that you can control include: whether Project lays out the diagram or you do, the arrangement of boxes on the diagram, the style and color of links, and some overall general options, like whether the background of the diagram is white or some other color you choose. To make changes to the way Project lays out the Network Diagram, on the Format menu, click Layout to open the Layout dialog box (see 11-2).
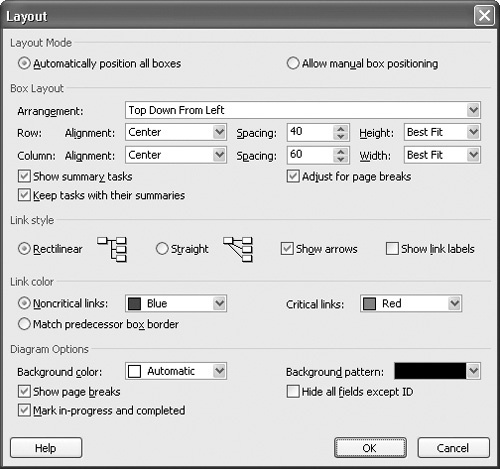
From this dialog box, you can tell Project to let you manually position boxes on the diagram instead of having Project position them for you. You can also change the order in which Project displays the boxes. Using the check boxes at the bottom of the Box Layout area, you can hide or display summary tasks, keep tasks with their summaries, and tell Project to adjust the Network Diagram for page breaks. You also can change the row and column alignment and spacing along with row height and column width.
Warning
Be careful here; people who are familiar with Network Diagrams might get confused if yours uses a non-traditional layout.
In the Link Style area, you can control the style of the link lines, and you can choose to show arrows and link labels. When you display link labels, Project includes on the line connecting tasks the letters of the type of dependency that exists between the two tasks, such as FS to mark a finish-to-start dependency.
In the Link Color area, you can select colors other than red and blue for critical and non-critical links. If you select the Match Predecessor Box Border option, link lines assume the same color as the box of the predecessor task instead of using the colors of critical and non-critical tasks.
You can use the choices in the Diagram Options area to change the general appearance of the Network Diagram by, for example, setting a background color and pattern for the Network Diagram.
You can change the appearance of individual Network Diagram boxes or of a particular category of boxes. Project uses a set of templates that define the shape, color, and content of each box, based on the type of task the box represents. You can override the settings of these templates. Since formatting box styles one at a time can be lengthy, time-consuming, and confusing to the reader, I suggest that you format all of the boxes for a particular type of task, such as all critical tasks. In this way, you’ll keep the appearance of each type of box consistent on your Network Diagram and make the diagram easier to understand.
To format all the boxes for a particular type of task, follow these steps:
On the Format menu, click Box Styles to see the Box Styles dialog box.
In the Style Settings For list on the left, click the type of task box that you want to format; its current format appears in the Preview window.
Note
You can select the Set Highlight Filter Style check box to choose formatting options for the selected box when it appears on a filtered Network Diagram. You can set all of the same options for the box in a filtered state as you do for its non-filtered state; just follow the steps in this section after you select the Set Highlight Filter Style check box.
In the Border area, click one of the 10 shapes for the box in the Shape list, click in the Color list the box’s line colors, and click in the Width list a line width for the box’s border.
In the Background area, click in the Color list a background color for the box, and click in the Pattern list a background pattern for the box.
Click OK to save the changes.

In addition to controlling the appearance of the boxes on the Network Diagram, you can control the information that appears in each box. By default, Project displays in each box the task name, duration, ID, start and finish dates, percentage complete, and resource name, if assigned. You can display up to 16 fields of information in any box, but just because you can doesn’t mean you should. If you display 16 fields, you’ll overwhelm your audience. But you can select the type of information to display to help your audience focus on issues of concern. For example, you might want to display the Free Slack and Critical fields along with Early Finish and Late Finish fields if you want your audience to focus on scheduling issues.
When you change the information that appears in the boxes, you change template information. I prefer to make a copy of the template and change the copy instead of changing the template directly; that way, the original templates retain their settings in case I want to use those settings.
Follow these steps to change the information that appears in the boxes on a Network Diagram:
On the Format menu, click Box.
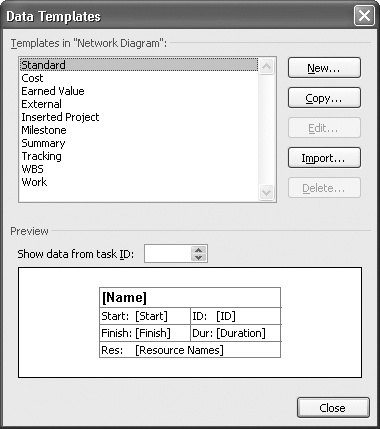
In the Format Box dialog box that appears, click the More Templates button to display the Data Templates dialog box:
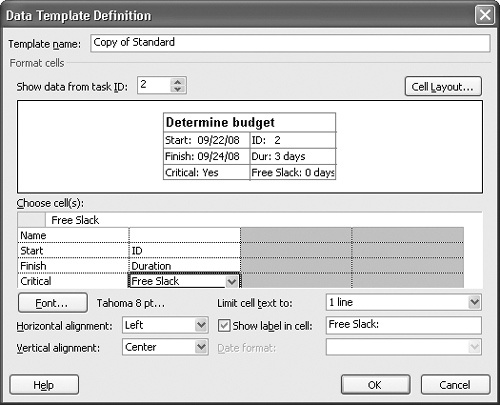
Select the template that you want to change and click the Copy button to display the Data Template Definition dialog box. The Preview shows the current appearance of the box, and the Choose Cell(s) section lists the fields currently displayed in the box.
To change the contents of a cell of the box, click the corresponding cell in the Choose Cell(s) area of the dialog box. Using the list arrow that appears to the right of the cell, choose a field to display for the selected cell.
Use the Horizontal Alignment list and the Vertical Alignment list to align the text in the cell, and use the Limit Cell Text To list to select the number of lines for each cell; a cell can have as many as three lines.
Select the Show Label In Cell check box to include a label in the cell that identifies the field.
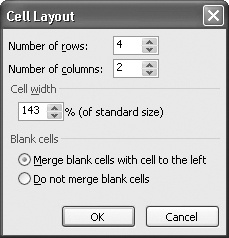
If you need more fields than are currently available or you want fewer cells in the box than currently exist, click the Cell Layout button to display the Cell Layout dialog box:
Specify the number of rows and columns—you can have up to four rows and four columns in a box—and click OK to redisplay the Data Template Definition dialog box.
Click OK, click Close, and then click OK once more.
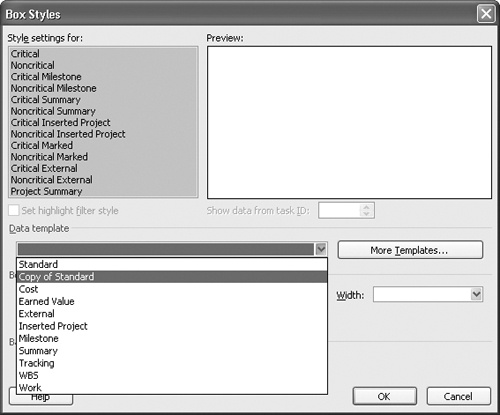
Project redisplays the Network Diagram, but your changes won’t appear if you made a copy of an existing template. You need to assign that template to the boxes in your Network Diagram that you want to display the information you set up. On the Format menu, click Box Styles to display the Box Styles dialog box (see 11-3). In the Style Settings For list, select each of the types of boxes to which you want to apply the template by pressing and holding Ctrl as you click each type of box. If you want to select all box styles, click Critical, press and hold the Shift key, and click Project Summary. Then in the Data Template list, click the template you modified. Click OK, and Project assigns your template to the types of boxes you selected. Project changes only the information that appears in each box. Project doesn’t change the box styles, so, for example, summary tasks still have slanted lines on their sides while subtasks appear as square boxes.