The core of most real-world games is the location-based map. That integration of the player's real-world position mapped into the virtual world extends the game's virtual elements into the real world, allowing players to explore the world around them with a new perspective and sense of exploration.
In this chapter, we will take our first steps to understanding how to integrate maps into a Unity game. However, before working with Unity, we will cover the basics of GIS and GPS. This will allow us to establish some simple definitions and background for what can be complex topics. After that, we will dive back into Unity and add a location-based map, a basic character, and free look camera to our Foody GO project. Even though we are dealing with advanced concepts, we will keep things simple for now and avoid getting into any code. Of course, more advanced readers with a background in GIS have the options to explore the code at their leisure.
Here is a quick breakdown of what we will cover in this chapter:
- GIS terminology and basic fundamentals
- GPS terminology and fundamentals
- Google Maps
- Importing assets
- Setting up services
- Debugging with CUDLR
GIS stands for geographic information system, a system in which geographic data is collected, stored, analyzed, manipulated, and served as maps. Although that definition is still prominent, GIS has come to mean everything from software applications, hardware, tools, science, and services. Google Maps, for example, is the best-known example of a GIS in use today. Yet, in this book, we will also use GIS to mean the science and process of converting geographic data and mapping.
Cartographers have been mapping the world around them for thousands of years. Yet only very recently with the development of computers did it become efficient to be used in computers and GIS to create dynamic maps. Unlike traditional hand-drawn paper maps, dynamically rendered maps are composed of layers of spatial data that could describe roads, points of interest, parks, boundaries, landscape, water, and more. As much as the common Google Maps user has little control over what layers are shown, they are there. The following is a figure that shows the typical layers that could comprise a road map:
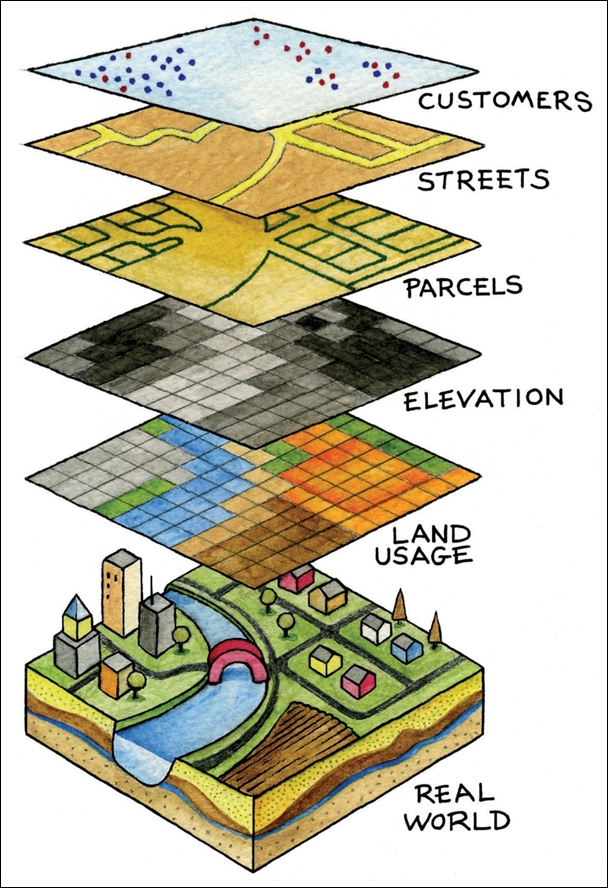
Source: http://bit.ly/2iri2vr
Google Maps, Bing, and other GIS providers will typically render maps at various zoom levels and then cut those maps into static image tiles. The GIS server then serves those tiles to the user. This works well for performance, but provides few options for customization or styling, aside from adding shapes, lines, or points of interest. This form of tile mapping is often referred to as static mapping. For this book, we will work with the Google Maps API, which provides us with dynamic maps.
Dynamic maps give the presenter or developer options to style and/or symbolize the data as required. For instance, on some maps, you may want to alter parks to be shown as blue instead of green. This is the type of flexibility that dynamic maps provides. When we will add the Google Maps API to our project later in this chapter, we will explore custom style and symbolization options.
Now that we understand the basics of GIS mapping, let's get into understanding some terminologies and concepts. The following is a list of terms we use when describing or making maps:
- Map scale: Geographical maps can represent everything from your neighborhood to the whole world. A map scale will often be rendered as text or graphic and provide the user with an understanding of the scope the map covers.
- Zoom level: This shares an inverse relationship with the map scale. Zoom level starts at 1, which represents a global view of the world, whereas zoom level 17 would represent a map showing your neighborhood. For our game, we will use a small map scale to allow the player to easily identify landmarks around them, which will equate to a zoom level of 17 or 18.
- Coordinate system: Various coordinate systems have been used across history to geographically locate points of interest. Many people will be familiar with latitude and longitude coordinates, but may not realize there are many different coordinate systems. In fact, the common latitude and longitude that we think is standard also has many variations. Since we will work with Google Maps in this book, we will use WGS 84 coordinates for everything we do. Be aware that if you do try to import data from other GIS, there could be differences that you may need to convert.
The following is a diagram showing WGS 84 major lines of interest:
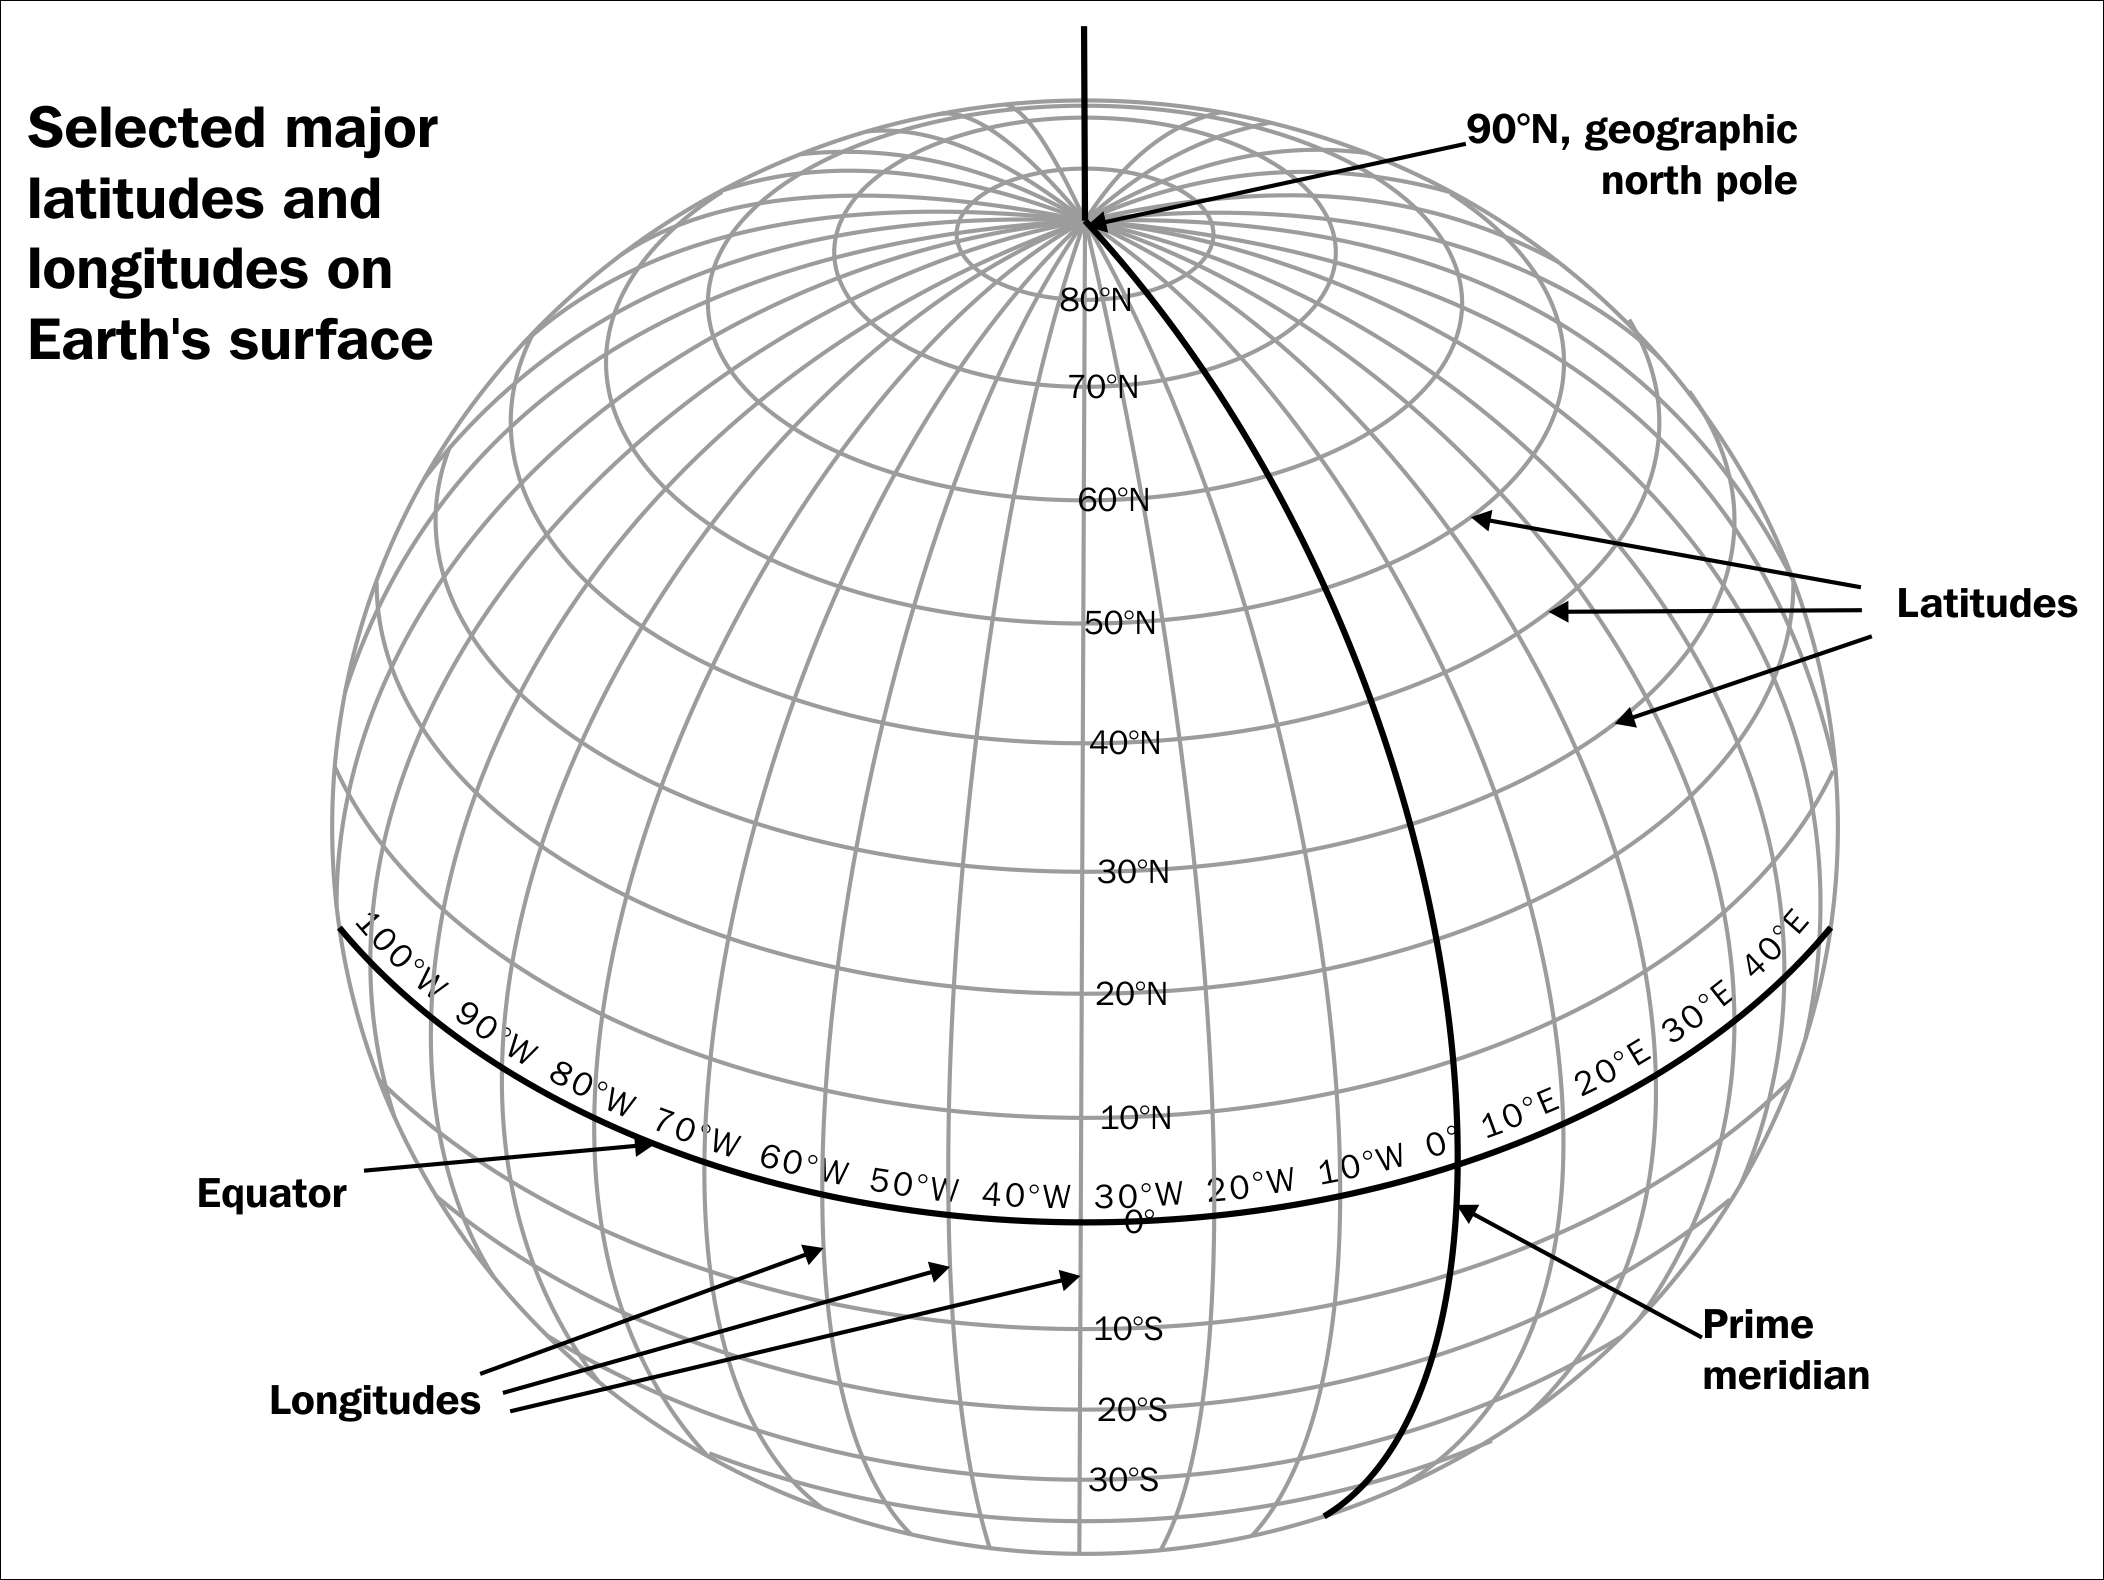
Source: http://bit.ly/2iOoPNG
Longitude west of the prime meridian is measured as negative. Latitude south of the equator is measured as negative.
- Map projection: One of the fundamental problems with mapping is representing our 3D sphere-shaped world onto a 2D service. Early cartographers resolved this issue by projecting a light from a globe onto a cylinder of paper and tracing the outline. The paper was then unrolled and a 2D view of the globe would be seen. We still use a similar method to render a view of our world. Although this 2D view is distorted as you near the poles, it has become the standard for most of our mapping needs. Suffice it to say there are many variations of map projections that are used for a variety of reasons. Other arguably better projection methods have been developed since, such as the Gall-Peters, which better accounts for the distortion at the poles. For us though, we will stick to the Google Maps' standard Google Web Mercator or just Web Mercator. The following is an example of a global map using Web Mercator projection on the left versus the Gall-Peters projection on the right:

Web Mercator projection on the left and Gall-Peters on the right