
Being able to debug your project's scripts in the editor is a great feature. Of course, being able to debug your script as it is deployed onto a target platform is like the Holy Grail for developers. No longer are you faced with unknowns about how your script/code is running on a device when you can actually watch the code run with remote debugging.
Remote debugging is a powerful feature that has been around for a while, but it does have limitations and may introduce its own connectivity problems. Before attempting to remote debug an application, be sure that you can deploy it to your mobile device without issues. If you have issues deploying your project to a device, this section will not help you. Instead, refer to the section on Issues and Solutions by Chapter at the end of this chapter.
Follow the given instructions to set up remote debugging in your editor:
- Use the project from the previous debugging exercise to get started. If you jumped here, then just follow steps 1-4 to open the project and set the scene.
- From the menu, select File | Build Settings. When the Build Settings dialog opens, click on the Add Open Scenes button to add the
Mainscene to the build. Then, set your selected deployment platform and check the Development Build checkbox, as shown in the following screenshot:
Build Settings dialog with scene added and platform chosen
- At this point, you may need to set additional Player Settings depending on your specific platform. Click on the Player Settings... button to open the PlayerSettings panel in the Inspector window. Then, set the required settings for your chosen platform, iOS or Android.
- The next step will depend on what platform you are deploying your game to:
- iOS:
- Ensure that your mobile device is connected to the same network (Wi-Fi) as your development computer.
- After you deploy the game, you can disconnect the USB cable.
- Android:
- Open a Terminal/CMD prompt and navigate to your
Android SDK/platform-toolsfolder - Enter the following command:
adb tcpip 5555 - This should output the following message:
restarting in TCP mode port: 5555
- Open your device and find the IP address by opening Settings | About | Status
- Write down or remember the IP address, and then enter the command, replacing your device IP address using following command:
adb connect DEVICEIPADDRESS
- Open a Terminal/CMD prompt and navigate to your
- This should respond with the following message, replaced with your IP address:
connected to DEVICEIPADDRESS:5555 - Confirm that the device is installed by running the following command:
adb devices - This should output something like the following (note that you may see an entry for your device by name):
            List of devices attached

            DEVICEIPADDRESS:5555 device
- iOS:
- Click on the Build and Run button on the dialog and save your file according to the name you set in the package identifier.
- After the simple demo loads and runs on your device, disconnect the USB tether. Then, return to your script editor. Use the instructions for your editor found in the following table:
- MonoDevelop:
- Press the Play button or F5 to start debugging
- Select the entry that matches your platform and device and click on the Attach button
Dialog showing Unity instances- Visual Studio (2015):
- From the menu, select Debug | Attach Unity Debugger
- A Select Unity Instance dialog will be displayed and it will list the instances you can connect to, shown as follows:
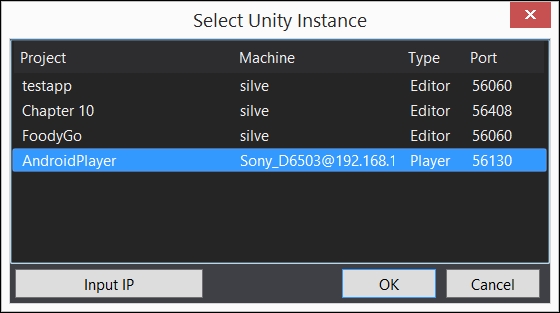
- Select the instance that matches your device (Type=Player) and click on OK
- You can now use the debugger as you would have locally
- Note that, while remote debugging, you may need to wait for certain actions, such as variable inspection, so be patient. This happens because the editor needs to retrieve the state from the remote device and not locally.
- When you are done debugging, click on the Stop button on the MonoDevelop or Visual Studio. This should remove the debugger and let the game continue running. On occasion, if the editor (usually MonoDevelop) gets locked, you have to close the editor.
Remote debugging is a great option for debugging code while developing, but in some situations you may want a few more advanced tools at your disposal. In the next section, we will cover a couple of advanced tools for debugging mobile applications.