
Out of the box, Unity Analytics is something you should have on anytime you release a game. It is essential to provide feedback about your players, the distribution of your game, and many other metrics. We will cover some of the basics of Unity Analytics in this section and then take a quick deep dive into using the tool to track critical errors and exceptions. Being able to access this information will provide you with better support for your game during off-site testing or release.
Follow the given instructions to enable Unity Analytics on your project:
- From the menu, select Window | Services. The Services window will open, typically over the Inspector window.
- Locate the Analytics group in the list and set the toggle button on the right to the On position, as shown in the following screenshot:

Turning Unity Analytics on
- Click on the Analytics panel in the Services window. You may get prompted to confirm the age guidelines of your game. If you do, just select an age greater than 13 and continue.
- The Analytics page will load in the Services window. Click on the Go to Dashboard button just below the main text. This will open your default browser and take you to the Unity Analytics site. You may have to log in with your Unity account, just do so when prompted.
- Once the page loads, you should see something close to the following screenshot:
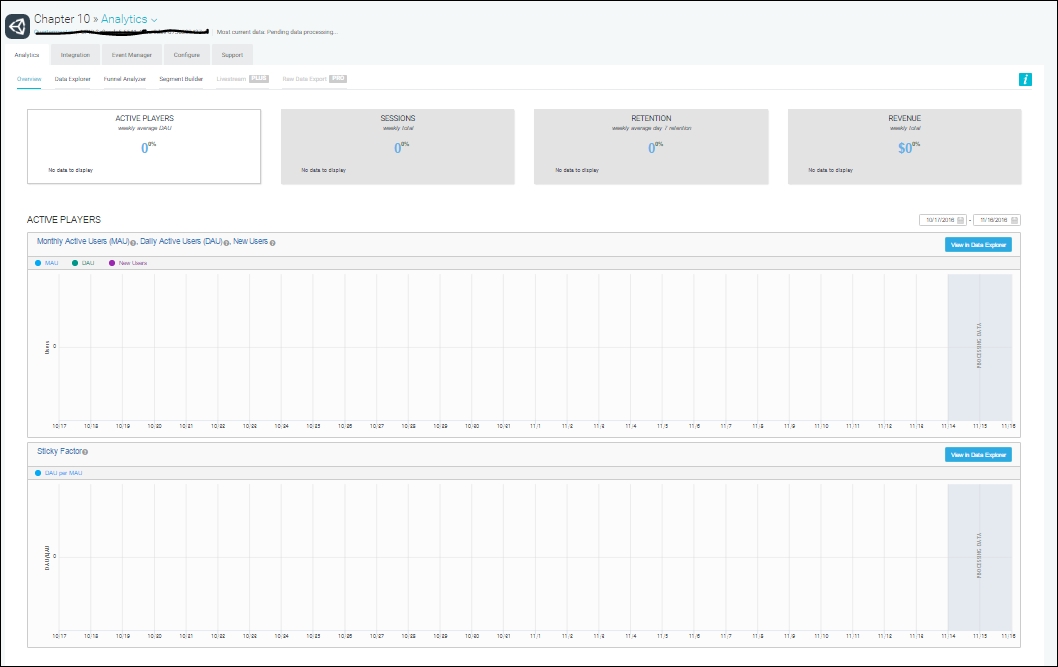
The Unity Analytics project page
Right now, your players, sessions, and other metrics will likely be sitting at 0. This is expected since you likely just enabled analytics on your project. Now, by itself, Unity Analytics won't track logging messages, but we can use some of the custom event mechanisms to track errors or exception logs. Fortunately, all the work for this has been encapsulated into a script called AnalyticsLogHandler.
Follow the given directions to set up this script:
- From the menu, select GameObject | Create Empty. Rename the object to
AnalyticsLogHandlerand reset the transform to zero. - Drag the
AnalyticsLogHandlerscript from theAssets/Chapter 10/Scriptsfolder in the Project window onto theAnalyticsLogHandlerobject. - The
RotateObjectscript that is attached to theCubein the sample Main scene logs an error message every time the object completes an entire rotation. - Press Play to run the scene in the editor. Wait for a few of those rotation error messages to log to the status bar, Console window, or CUDLR window. Unfortunately, you will have to wait an additional 12-14 hours before the message will appear in the Unity Analytics dashboard page.
- After 14 hours, return to the analytics dashboard and review the event viewer messages by selecting the Event Manager tab, as shown in the following screenshot:
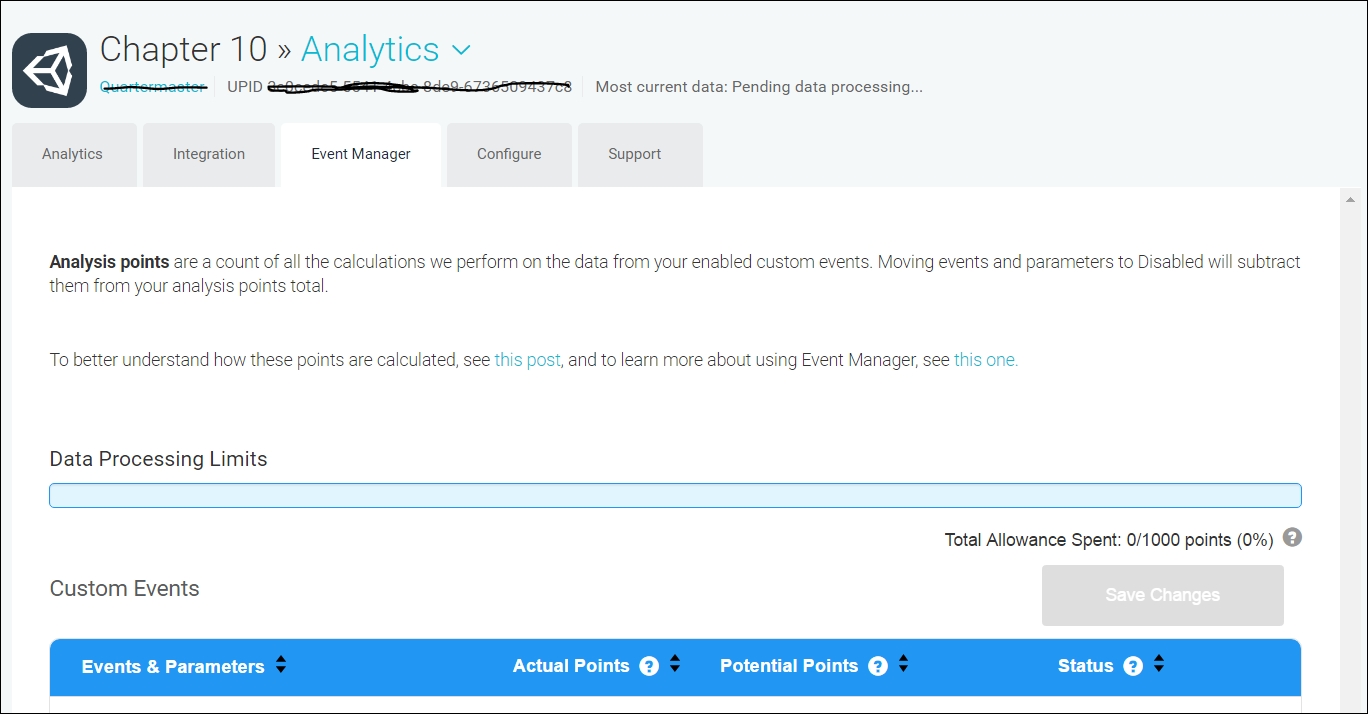
The Event Manager tab on the Unity Analytics dashboard
Let's take a look at the AnalyticsLogHandler script, as illustrated:
using UnityEngine;
using UnityEngine.Analytics;

public class AnlyticsLogHandler : MonoBehaviour
{
    public LogType logLevel = LogType.Error;
    void Awake()
    {
        Application.logMessageReceived += Application_logMessageReceived;
    }

    private void Application_logMessageReceived(string condition, string stackTrace, LogType type)
    {
        if (type == logLevel)
        {
            Analytics.CustomEvent("LOG", new Dictionary<string, object>
            {
                { "msg", condition },
                { "type", type.ToString() }
            });
        }
    }
}
This script is simpler, but the implementation is similar to the CustomLogHandler script we looked at earlier. There is one major difference and that is the use of the Analytics object to create a CustomEvent that then automatically gets sent to Unity Analytics. In this case, we are using the method to track logging messages or other error conditions. Of course, you could add that snippet of code anywhere you wanted to track a custom event in your game.
Once you start collecting custom events, be it from errors or other regular game activity, you can plot these metrics against other metrics. For instance, you could plot the number of errors per user or as per the number of game sessions, which would tell you how critical or benign an error is and how quickly you may need to respond. Setting up those plots is outside the scope of this book but worth some investigation on the Unity site when you have time to do so.
As you saw, analytics can be a great tool for not only tracking player activity, but also other activities, such as errors or other custom events. In the next and final section of the book, we will look at other issues you may have encountered during the course of this book, with possible solutions, of course.