
In this recipe, we will learn how to analyze and interpret the results, and determine what sites are Lync-ready.
Browse to the Graphical results sheet and click on the Update tables and graphs green button.
We will be presented with summary site tables and two diagrams, which will give immediate visual indication of readiness, as shown in the following image (note that we have split the sections for better readability):
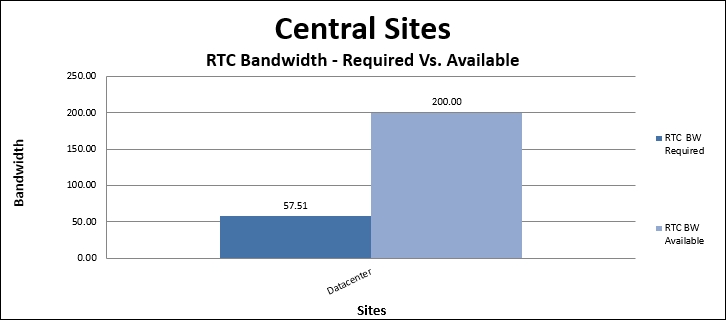
The first picture to look at is the one for Central Sites. The light bar in the preceding graph indicates our total RTC bandwidth availability for RTC (200 mbps), and the dark bar is the calculated amount of bandwidth required (57.51 mbps) to support Lync traffic for all branch sites associated with the Datacenter central site. The good news here is that we can safely assume our WAN capacity to the datacenter is more than enough.
The following graph provides a detailed breakup of the available bandwidth versus the bandwidth required for each branch office.
For example, New York's total WAN capacity is 100 mbps, with 20 mbps reserved for RTC, and the latter is the value reflected in the next image:
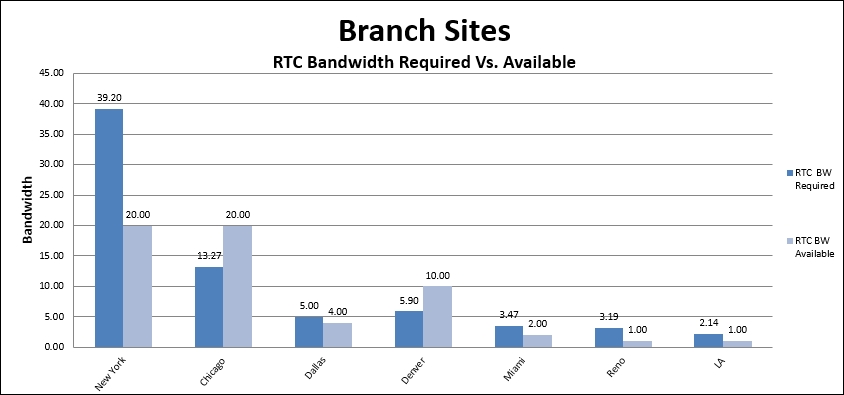
Without digging into the actual numbers for now, we can get an immediate overview through the bar diagram and make the following statements:
- For New York, the required bandwidth is far more than the available one (20 mbps is available, but almost double of what is available is required)
- Miami, Reno, and LA also require considerably more bandwidth than the available one
- Chicago and Denver have considerably more bandwidth availability than required and can be safely regarded as Lync-ready
- Dallas requires more bandwidth than the available one, but there is room for adjustments, which may turn this site into a Lync-ready one.
Now, browse to the Deployment readiness tab and review the pie diagrams; these contain a summary of the number of sites that require a WAN upgrade or perhaps usage adjustments before they can be considered Lync-ready.
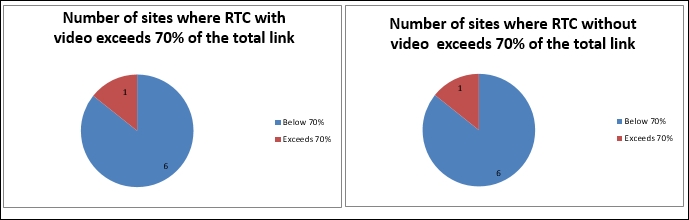
What useful information can we retrieve from the preceding images? Remember when we configured the Flag in red when WAN BW usage exceeds this value to 70 percent? This is where the parameter is reflected. It works as a "warning level" that tells us how many sites go beyond 70 percent WAN usage for the total link capacity. Be careful about this point. The takeaway from this output is that if we could reserve a greater amount of WAN bandwidth for RTC, possibly up to 70 percent, this would result in only one site, exceeding this threshold.
Note
In a real-world scenario, you will want to set this threshold to a level that you know will not affect your existing line-of-business applications that already make use of your WAN. Acquiring real-time network usage statistics from your WAN carrier or through specialized network monitoring software is paramount to determine an acceptable threshold.
The following pie diagram takes into account the overall network readiness based on the bandwidth we originally allocated in the calculator (20 percent):
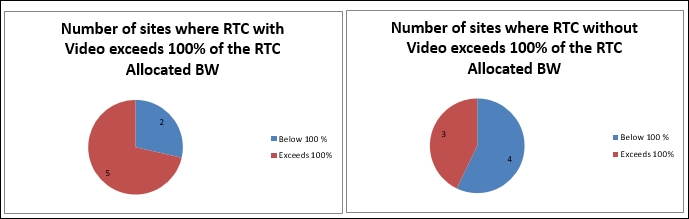
As shown in the previous diagram, we are provided with two outputs, one with a video and one without. The takeaway from this is as follows:
- If we do consider the video, out of seven sites, two meet network compliance, while five do not.
- If we do not consider the video, out of seven sites, four meet network compliance, while three do not. This provides a potentially useful indication that a tune-up in persona definitions and/or more strict control over allowing videos for some users might turn the situation for some sites and make them Lync-ready without a WAN bandwidth upgrade.
If we need to further break down to actual values, another useful resource is the sites tab. Scroll down and then sideward until the following is displayed on your screen:
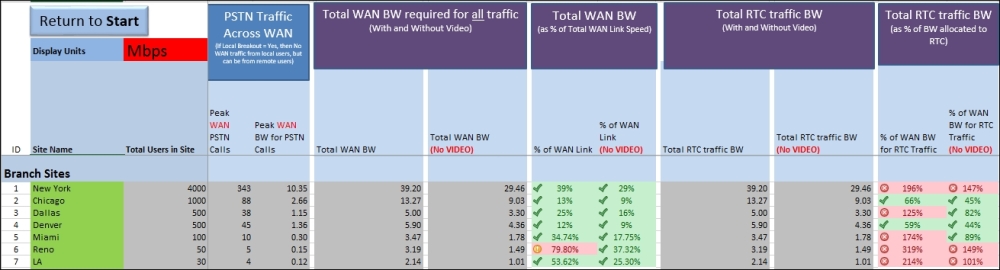
This table reveals the following:
- Reno is the only site (that scores 79.80 percent) that is exceeding 70 percent threshold over the total WAN link bandwidth. Provided 70 percent is our non-negotiable hard limit, this confirms that the site requires a WAN upgrade for Lync.
- Miami scores 89 percent total RTC bandwidth with the video and 174 percent total RTC bandwidth without video. This is a definite indication that 20 percent reserved bandwidth gets us very close to threshold even without the video, and largely over the limit with video. However, if we consider the maximum nominal Miami WAN link, it only scores 34.74 percent; in other words, doubling-up the reserved RTC bandwidth would render the site RTC-ready.
You might have noticed that the tool allows for great flexibility in setting up and customizing several parameters for each site.
It is important to notice that values might have to be adjusted in specific circumstances, and ultimately, you are leveraging statistical usage models (personas) that cannot guarantee a perfect match with the real world. An exact calculation is only revealed through usage; furthermore, network usage can continuously vary depending on the user's evolution, trends (video adoption is a slowly but constantly growing one), and evolving business objectives.
In these aspects, the tool provides an excellent overview, and ultimately, it is an essential resource to highlight likely network bottlenecks that need to be addressed before deployment as an essential milestone in every successful Lync deployment project.
- The Lync 2013 and 2013 bandwidth calculator tool download package includes a user guide that covers advanced scenarios. It is available at http://www.microsoft.com/en-us/download/details.aspx?id=19011.