
Snooper is a tool used to analyze log files in Lync Server. It is a tool we will use over and over to read different kinds of logs and information that come from Lync Servers and endpoints. While Snooper has been available since Microsoft Lync Server 2010 Resource Kit, some of the ways we use it have changed with Lync Server 2013 because the server architecture now includes an element called Centralized Logging Service (CLS). CLS is a great alternative for the previously used solution, the OCSLogger, which required a lot of work to gather data from multiple servers. The architecture is based on a service executable, the Centralized Logging Service Agent (ClsAgent.exe), which runs on each Lync 2013 server, and waits for commands from the service controller CLSControllerLib.dll that sends Start, Stop, Flush, and Search commands to the ClsAgent. The ClsAgent uses scenarios that define which Lync components (providers) at what level will be captured in the traces. There are default scenarios and custom scenarios (created with the New-CsClsScenario command). Two scenarios can be run on a given computer at any one point in time. This means you can run a default or a custom scenario in addition to AlwaysOn logging (a special scenario that can be enabled to log all the time). We will see how to enable CLS and how to use Snooper to examine the logs it generates.
Snooper is part of the Lync Server 2013 Debugging Tools, and we are able to download them from the Microsoft site at http://www.microsoft.com/en-us/download/details.aspx?id=35453, or we can use the Set-Cs2013Features.ps1 script from Pat Richard's site (http://www.ehloworld.com/1697). I always suggest that you use the previously mentioned script to automate the installation of the prerequirements for Lync Server roles and for an easy download and installation of additional tools.
- To see a complete list of the existing scenarios, we can use the
Get-CsClsScenariocmdlet. A server with the latest updates applied (right now, Microsoft Lync Server 2013 and Core Components 5.0.8308.803) will show 29 scenarios. - To view the details about a single scenario, we can use a cmdlet like the following one (for the media connectivity scenario):
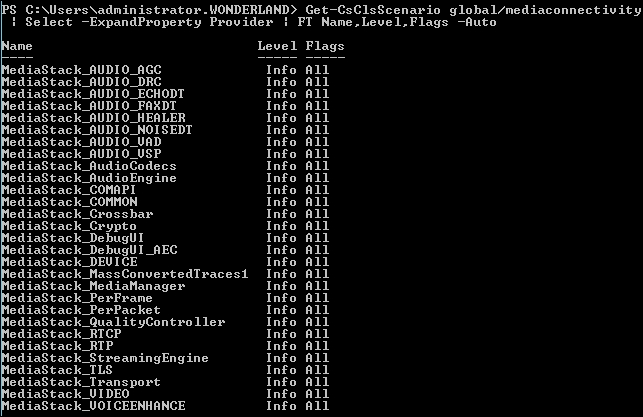
Get-CsClsScenario global/mediaconnectivity | Select -ExpandProperty Provider | FT Name,Level,Flags –AutoThe result will be the one shown in the following screenshot (including the flags for monitored information and the log level):
- After we have selected the scenario that best fits our needs, we have to launch the CLS process with the following cmdlet (note that madhatter.wonderland.lab is the name of the Front End pool):
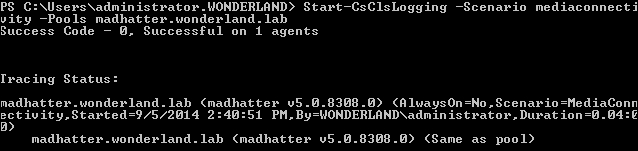
Start-CsClsLogging –Scenario mediaconnectivity –Pools madhatter.wonderland.labWe will receive a confirmation message, like the one in the following screenshot:
- Use the
Stop-CsClsLoggingcommand (otherwise, logging will continue to capture data for four hours, which is the default). Another option is to use theSync-CsClsLoggingcommand (in our scenario, Sync-CsClslogging –Pools madhatter.wonderland.lab). Both theStop-CsClsLoggingandSync-CsClsLoggingcommands will write the information stored in memory to an ETL file that we are able to search. - To make use of the results generated from CLS, we must use a cmdlet like the following:
Search-CsClsLogging -OutputFilePath "C:CLSresult.log" - It is also possible to insert only information from specific components in the log, with a cmdlet like the following one, focused on RTCP:
Search-CsClsLogging -Components MediaStack_RTCP -OutputFilePath "C:Transport.log" - Now, it is useful to launch
Snooper.exefrom the Lync debugging tools installation folder (for example,C:Program FilesMicrosoft Lync Server 2013Debugging Tools). - Select File | Open file and click on one of the previously generated logs.
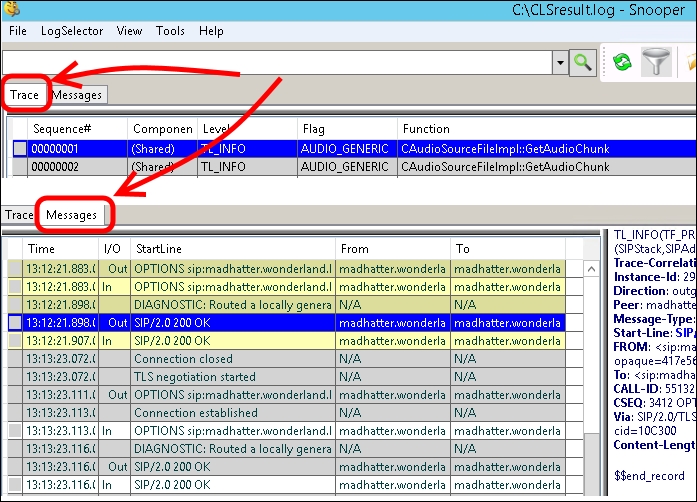
- Snooper will parse the log and create two views: one dedicated to the visualization of all the information available (Trace), and the second with a list of messages organized in groups, with the errors on the left (Messages), similar to what we are able to see in the following screenshot:
You may also rely on third-party tools to ease the Centralized Logging Server management. We describe one of these in Chapter 5, Scripts and Tools for Lync, in the Tracing made easier – Lync 2013 Centralized Logging Tool recipe.
- There is an interesting session from the TechEd North America 2014 titled Advanced Troubleshooting for Microsoft Lync at http://channel9.msdn.com/Events/TechEd/NorthAmerica/2014/OFC-B411#fbid=, which is focused on troubleshooting and the related tools in Lync, including Snooper. The speakers propose a systematic approach to troubleshooting, which could be important to keep in mind.