
The Call Diagnostic summary gives us an overview of the health status of our Lync deployment. What is remarkable about the Call Diagnostic Reports is the number of levels we are able to drill down to obtain more and more information about a single event or a single session error. While we also have other tools to log and record events, the previously mentioned monitoring report makes it easier to find the information we need.
- The first level we are able to see is Call Diagnostic Summary Report that contains the Peer-to-Peer Activity Diagnostic Report and Conference Diagnostic Report options.
- From the Monitoring Server Reports starting page, we are able to select Call Diagnostic Summary Report.
- The Diagnostic Summary page contains the following three main fields:
- Two fields to define a data range are shown in the following screenshot:
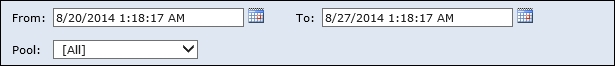
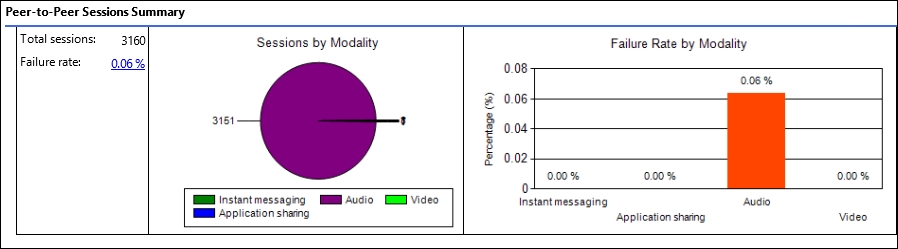
- Peer-to-peer Sessions Summary that contains information on the success and failure in peer-to-peer (one-to-one) communication sessions is shown here:
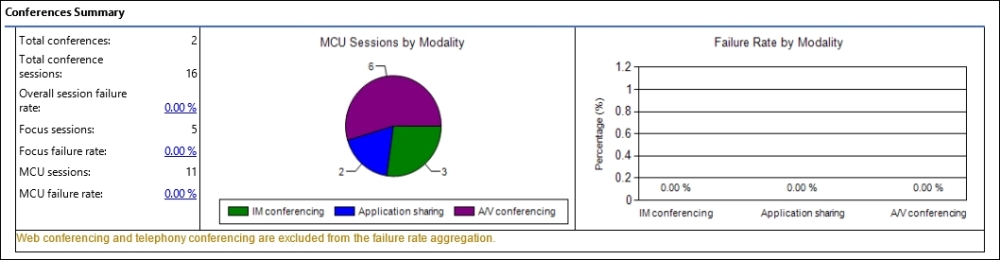
- Conferences Summary that contains information on sessions that involve more than two users is shown in this screenshot:
- Two fields to define a data range are shown in the following screenshot:
- Looking at the pie charts in our example, we first have an overview regarding the kind of traffic we have managed in the selected period. In our examples, peer-to-peer was almost totally composed of audio calls, while the bulk part of the conference is composed of A/V Conferencing.
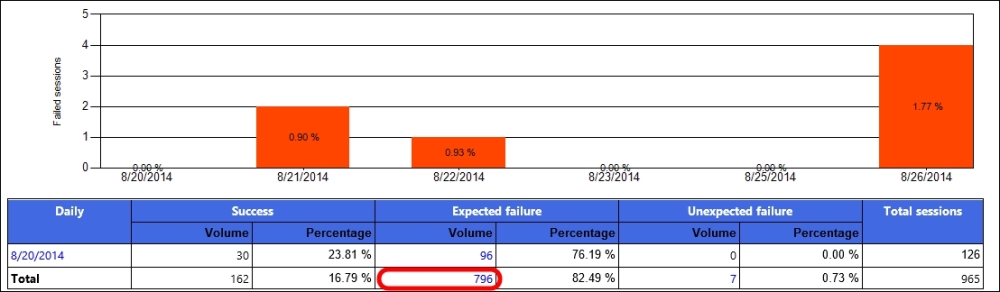
- The bars on the right-hand side are the failure rates for each modality. They simply show how many sessions were not established successfully. Clicking on one of the bars will show details on the reasons behind the failure rate. In the following screenshot, we have clicked on the Audio Failures bar, and we are able to see a peer-to-peer activity diagnostic report that is based on day-by-day output:
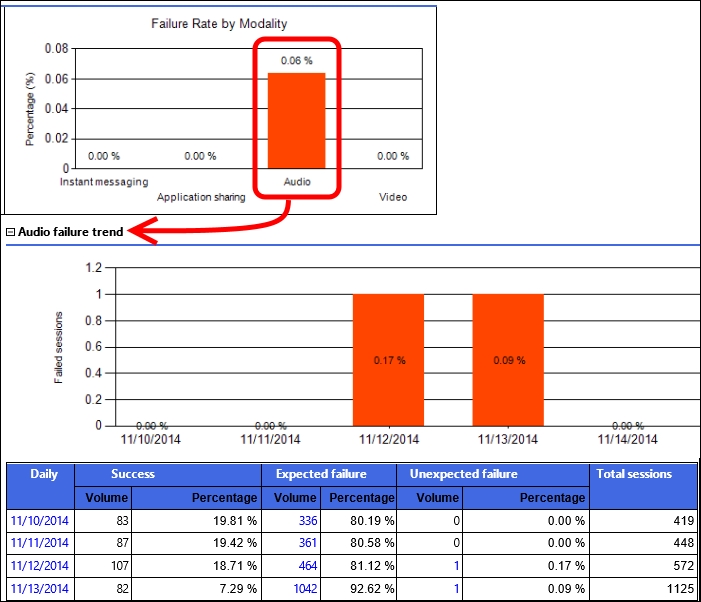
- The way the information is divided in columns might not be intuitive. As we can see in the following screenshot, we have Success, Expected Failure, and Unexpected Failure:

- Success is a call that starts and closes as expected. Expected failure includes all the sessions we were not able to establish for normal reasons (such as a call to a nonexistent phone number). Unexpected failures can arise as a result of network or device-related issues. The information is divided on a daily basis, and it helps in establishing whether the problem was due to a specific problem on a specific day or whether it was due to something in our configuration or deployment.
- The total number of failures is also a link to Failure Distribution Report, as shown in the following screenshot:
- Failure Distribution Report helps us in defining trends and patterns in our errors and also in defining the specific diagnostic reason for the most frequent errors (the Top diagnostic reasons table is shown in the following screenshot). The Top pools table shows how failures are distributed among our Lync Front End servers.
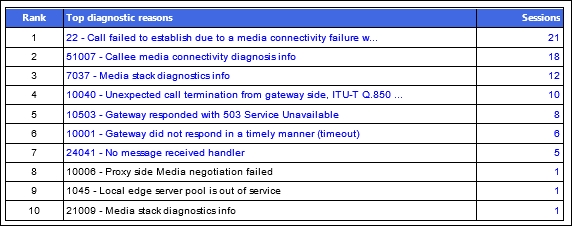
On the same page, we also have the Top Sources, Top Components, Top from users, Top to users, and Top from user agents tables.
- Clicking on the number of events to the right of each element, we can see that the number of event is a link to another level of reporting:

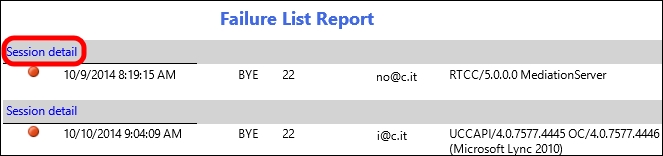
- Now, we can examine every single event related, for example, to a calling user number (see the following screenshot). Note that there is a Session Detail link that allows us to go to a further level of detail:
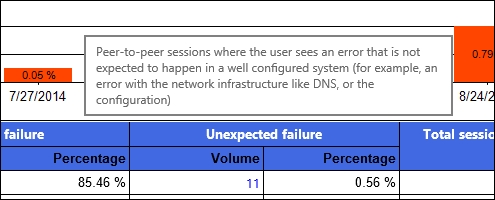
- The Peer-To-Peer Session Detail Report option is an in-depth look at the session detail error. In the following screenshot, we also have a demonstration of the "highlighting" feature that points out errors using yellow and red colors. Hovering the mouse over the errors will bring up information on this kind of message.
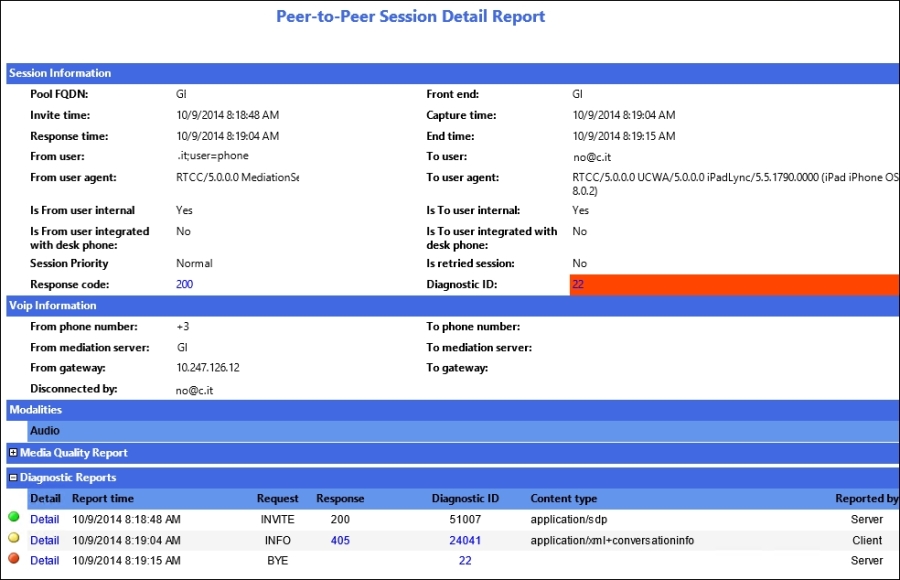
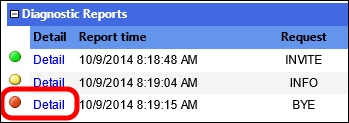
- In the Diagnostic Reports tab, there can be additional details linked in the same manner, as shown in the following screenshot:
..................Content has been hidden....................
You can't read the all page of ebook, please click here login for view all page.