The Lync Pilot Deployment Health Analysis Tool is a lesser known Excel-based utility included in the Microsoft Lync Rollout and Adoption Success Kit. The tool retrieves and displays a summary of the key issues indicators, such as the most common failure code, in a simple way, serving as a precious complement (not a replacement!) to the most comprehensive information retrievable through Lync Monitoring Server and the related reports based on SQL Reporting Services. These are not only recommended but also required for the tool to work properly. Despite the pilot in its name, it is a valuable tool to provide a snapshot of the overall call quality even on aged production environments.
The tool is a Microsoft Excel file called Lync Pilot Deployment Health Analysis v1.1 (Lync 2013).xlsm. It is available as part of the Microsoft RASK available at http://www.microsoft.com/en-gb/download/details.aspx?id=37031.
Ensure that the following prerequisites are met before using the tool:
- Microsoft Excel is installed on the machine from where you run the file
- The machine from where you run the file has connectivity to your Lync deployment
- The Lync Monitoring Server role must be deployed
- Call Detail Records and Quality of Experience policies must be configured to capture data
Retrieving report information requires some initial configuration. Start the file, navigate to the setup sheet, and configure the fields, as shown in the following screenshot:
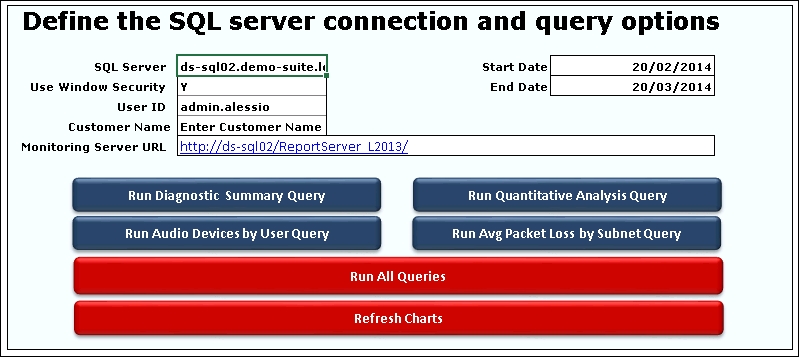
The following parameters need to be set:
- SQL Server: Use the FQDNinstance notation of the server where the Monitoring databases are placed, for example:
ds-sql02.demo-suite.localLYNC. - Use Windows Security: Leave it at the default value.
- User ID: This refers to the user that will run the queries to monitor the databases; it therefore must be granted the minimum permission of
db_datareaderfor theLCSCdrandQoEMetricsdatabases. - Customer Name: Enter your organization's name here. The name will be used on various generated charts.
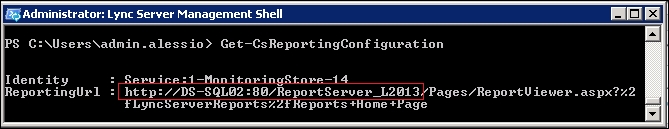
- Monitoring Server URL: Input the base URL where your Lync monitoring reports are installed.
Make sure that you only include the base link to the reports server, as shown in the following screenshot:
Once a start and end date is configured and defined, you are ready to run the query of your choice (blue buttons) or red button. For our demo, please click on Run all queries.
Note
Use the Run All Queries feature with caution, especially if associated with huge date ranges and/or large deployments. Queries will need considerable time to run (Excel might become temporarily unresponsive), and this might affect the Lync SQL server's backend performance. It is sensible to run such extended queries after business hours, if required, and monitor SQL Server's performance impact for the future.
Among the several reports that you will want to review, two of these should be your earliest stops.
The Reliability Report tab is a dashboard of the weekly session success rate for all core modalities (conferencing, peer-to-peer voice, and so on). It provides an immediate summarization of how the system is performing in the current week and how it did in the previous week, as shown in the following screenshot:
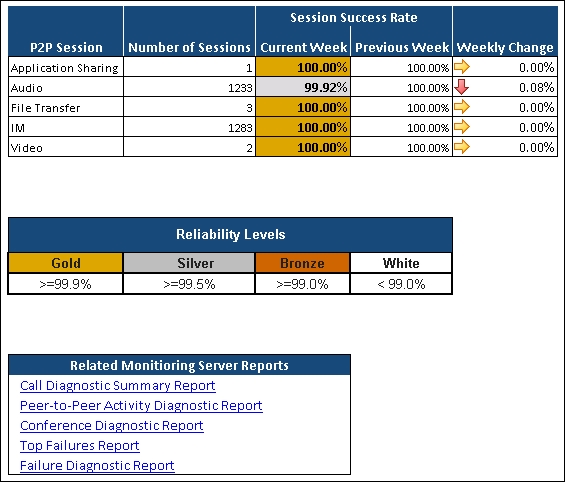
The Weekly Change column indicates the change in the success rate from the previous week's results. This is a great indicator of the deployment health trend. Large shifts in values between two consecutive weeks should be promptly investigated. The Diagnostic Comparison tab should be used to find the frequency of specific error codes that affect the session's success rates. The overall performance quality is categorized in three color codes:
- Gold: This indicates that the success rate is greater than or equal to 99.9 percent
- Silver: This indicates that the success rate is greater than or equal to 99.5 percent
- Bronze: This indicates that the success rate is greater than or equal to 99.0 percent
- White: This indicates that the success rate is below 99 percent
Your next stop should be the Diagnostic Comparison tab. This provides a more detailed view of the recurring failures that are affecting the platform.
Note
Information on specific diagnostic codes can be found in the ms_diag.html file, which is provided with the Lync Server 2010 Resource Kit Tools. The file is located in the <Lync Resource Kit Installation Path>Tracing directory. Alternatively, you can view them at http://msdn.microsoft.com/en-us/library/gg132446(v=office.12).aspx.
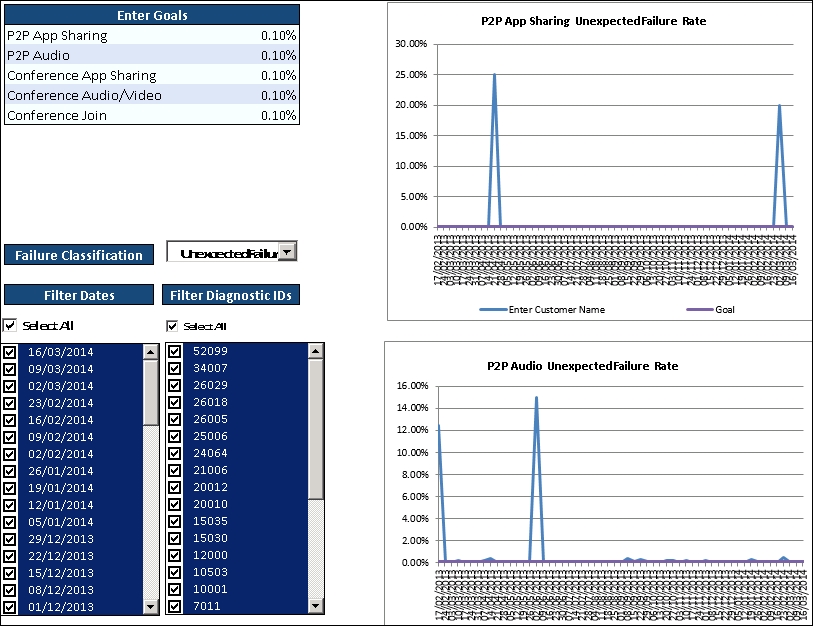
The Diagnostic Comparison tab is split into the following five main sections:
- Goals: This is where you set your acceptable failure rate for each modality (this defaults to 0.10 percent for unexpected failures). These values will define the purple goal line on each of the charts.
- Classification Filtering: This is used to break down to the exact percentage of each session result. You should emphasize the unexpected failures' results as they are health indicators of your Lync Server infrastructure. The data can be further filtered so that it only shows specific weeks and diagnostic codes.
- Related Reports: This links to the reports available for additional troubleshooting.
- Charts: These visually display the trending of the specific component's health throughout the date range specified in the Setup tab.
- Date Drilldown: This further filters specific error codes that might be causing spikes in the failure rates seen in the charts.
The following screenshot shows all the parameters: