
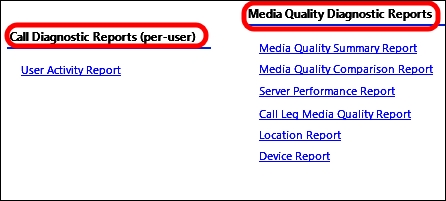
Lync reports enable more than one approach to the assessment of errors and trends in call quality. The starting page of the monitoring reports offers two different starting points for this kind of activity: Call Diagnostic Reports (per user) and Media Quality Diagnostic Reports (as shown in the following screenshot). We will look at both of them.
- The User Activity Report option contains a full list of all the users' activities in the defined range of time. We have some filters available. In the following screenshot, I have pointed out the drop-down menus: the one related to Activity Type (the available options are Peer-to-peer, Conference, or Both) and the one related to the Session Category (the available options are Success, Expected Failure, Unexpected Failure, or All). The view is the one that shows unexpected failures in all the category types.
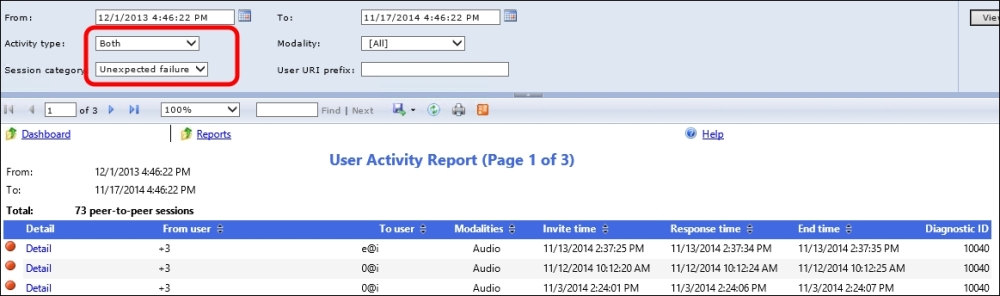
- User activity reports give access to every single activity performed by a specific user. The Detail link offers access to a detailed report screen that includes Media Quality Report; this includes information on the call and details on the audio and video quality.
- Media Quality Diagnostic Reports include the following reports:
- Media Quality Summary Report
- Media Quality Comparison Report
- Server Performance Report
- Call Leg Media Quality Report
- Location Report
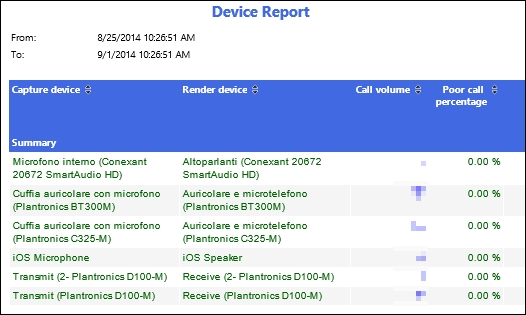
- Device Report
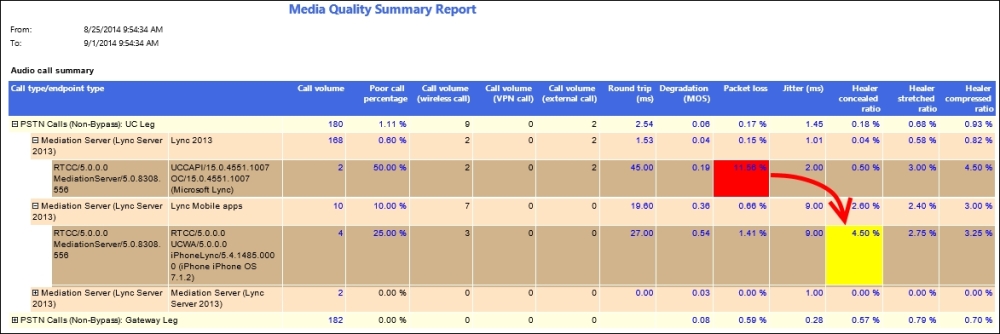
- The Media Quality Summary Report option includes many quality-related counters such as MOS (Mean Opinion Score), which is a methodology for subjective testing (because the quality of speech is based on a human perception). Other parameters include Jitter (a measure of distorted or lost audio, typically caused by network congestion) and Healer concealed ratio (usually caused due to packet loss or jitter). In the following screenshot, we have a high number of lost packets that cause an increase in Healer concealed ratio:
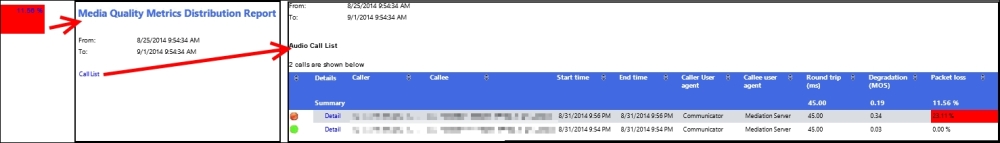
- The Percentage of Packet Loss option is a link to Media Quality Metrics Distribution Report and after selecting Call List, we have a further step, the Call List Report. Inside the Call List Report option, we are able to see that in our example, there was a single call with a high number of lost packets, as shown in the following screenshot:
- The Media Quality Comparison Report option is a view of daily calls from multiple points of view (such as Call Volume, MOS, and Poor call percentage).
- We will talk about Call Leg Media Quality Report later in this chapter. The last report that we will talk about is Device Report; it reports the quality of the calls related to the different devices that were used, as illustrated here:
Metrics and details about the User Activity Report are available on the TechNet post, User Activity Report in Lync Server 2013, at http://technet.microsoft.com/en-us/library/gg558638.aspx. More information on MOS is available in the TechNet post, Mean Opinion Score and Metrics, at http://technet.microsoft.com/en-us/library/bb894481(v=office.12).aspx.
- The Lync 2013 Rollout and Adoption Success Kit post at http://www.microsoft.com/en-us/download/details.aspx?id=37031 includes the Lync Pilot Deployment Health Analysis Tool. It is an instrument that helps in identifying Lync errors and evaluating call quality. Michael LaMontagne has published an interesting post on this topic, Lync Pilot Deployment Health Analysis Tool, at http://d1it.wordpress.com/2013/10/24/lync-pilot-deployment-health-analysis-tool/.
- Curtis Johnstone has published an interesting post (focused mainly on the audio-quality side of the reports) on Lync monitoring, titled A Primer on Lync Audio Quality Metrics at http://blog.insidelync.com/2012/06/a-primer-on-lync-audio-quality-metrics/.
..................Content has been hidden....................
You can't read the all page of ebook, please click here login for view all page.