
Every developer will, at some point, face an unexpected issue or problem that blocks their progress to further development. It could be something as malignant as a hidden syntax error or far more serious. Either way, the developer must use the tools at their disposal and work past the problem. This chapter will take a look at introducing or familiarizing you with the various troubleshooting tools available to mobile Unity developers. After that, we will take a more advanced look at some specialized tools to use when the problem seems especially difficult. Of course, we will also want to cover options for tracking issues or even preventing them. Then, at the end of this chapter, there will be a table provided for reference, to assist you in solving issues that you may encounter working your way through the chapters in this book. Here is a list of the major topics we will cover in this chapter:
- Console window
- Compiler errors and warnings
- Debugging
- Remote debugging
- Advanced debugging
- Logging
- CUDLR
- Unity Analytics
- Issues and solutions by chapter
If you have jumped ahead to this chapter from a previous section of the book, and you can't get past due to an issue, then please jump ahead to the last section in this chapter, Issues and Solutions by Chapter.
The Console window should be your starting place whenever you encounter an issue. It can be accessed from the menu by selecting Window | Console, which will open the Console window that you can dock within the editor as you see fit. Depending on your preference and experience, you may want to always have the Console visible. Either way, as soon as something goes wrong, it certainly should be the first place you check.
Let's take a quick tour of the Console window in some detail, as it will be central to several other elements in this chapter:
- Be sure to have the Unity editor open. If the Console window is not open, then open it from the menu by selecting Window | Console.
- Take a look at the window and familiarize yourself with the buttons and context menu. The following is a screenshot of the Console window with the typical configuration:
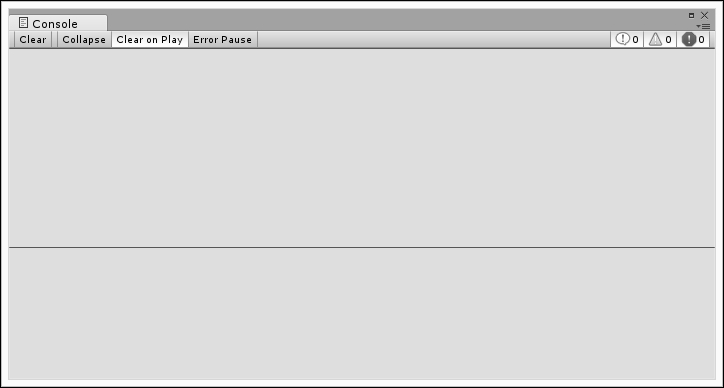
The Console window with typical configuration
How about we take a look at what each of the buttons do and some helpful hints you may not find in the Unity documentation:
- Clear: This clears the current window of all messages. It can be useful to clear your log on extended testing sessions.
- Collapse: This will collapse all of the same log messages and identify label with a number. This is especially useful if you have a repeating message you want to track, but don't want the window to be overwhelmed with messages.
- Clear on Play: This clears the log on every new session run in the editor. It is very useful and something you will want to have on all the time.
- Error Pause: This causes the editor to pause when an error is encountered during play. This is another great feature that lets you catch those errors as they happen. Unfortunately, you cannot isolate the type of error you want to track.
The icons on the right-hand side of the window are described as follows:
- Info Filter: This is the first button on the right-hand side. This will filter on/off any info or general debug messages sent to the Console. It is a useful way to block out noise.
- Warning Filter: This is the button with the yield sign--a filter you can use to turn warnings on/off, again to reduce noise in the window. Avoid the impulse to turn off warnings; they are helpful reminders that you will want to reduce in number.
- Error Filter: This is the last button on the right, and is a filter to turn error messages on/off. Generally, it's a good idea to always keep this filter on. However, on occasion, it may be useful to ignore noisy errors that are filling the window in order to track a missing debug message.
The context menu is explained as follows:
- Click on the Console window context menu icon located in the far top-right corner of the window. This will open the context menu, as shown:
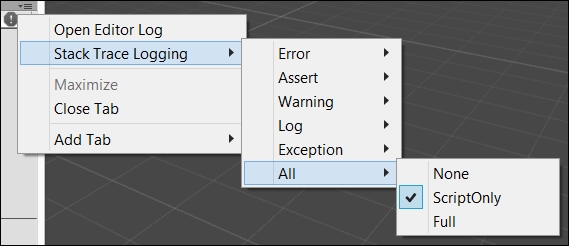
Console window context menu shown
- In order to be thorough, let's explain the log menu items, as follows:
- Open Editor Log: This will open the detailed log for the editor. We will look at this log in more detail when we get to the section on logging.
- Stack Trace Logging: This sets the amount of stack trace to be included in the Console log. Generally, you will only set this to ScriptOnly, as shown in the screen excerpt. Again, we will cover this option in more detail in the sections on debugging and logging.
So, the next time something goes wrong, be sure to start with opening the Console. In the next section, we will look at a set of compiler messages sent to the Console.