

i
i
i
i
i
i
i
i
2 3
2 3
Erik Reinhard
Tone Reproduction
As discussed in Chapter 22, the human visual system adapts to a wide range of
viewing conditions. Under normal viewing, we may discern a range of around 4
to 5 log units of illumination, i.e., the ratio between brightest and darkest areas
where we can see detail may be as large as 100, 000 : 1. Through adaptation
processes, we may adapt to an even larger range of illumination. We call images
that are matched to the capabilities of the human visual system high dynamic
range.
Visual simulations routinely produce images with a high dynamic range
(Ward Larson & Shakespeare, 1998). Recent developments in image-capturing
techniques allow multiple exposures to be aligned and recombined into a single
high dynamic range image (Debevec & Malik, 1997). Multiple exposure tech-
niques are also available for video. In addition, we expect future hardware to be
able to photograph or film high dynamic range scenes directly. In general, we
may think of each pixel as a triplet of three floating point numbers.
As it is becoming easier to create high dynamic range imagery, the need to
display such data is rapidly increasing. Unfortunately, most current display de-
vices, monitors and printers, are only capable of displaying around 2 log units
of dynamic range. We consider such devices to be of low dynamic range. Most
images in existence today are represented with a byte-per-pixel-per-color chan-
nel, which is matched to current display devices, rather than to the scenes they
represent.
Typically, low dynamic range images are not able to represent scenes with-
out loss of information. A common example is an indoor room with an out-
597

i
i
i
i
i
i
i
i
598 23. Tone Reproduction
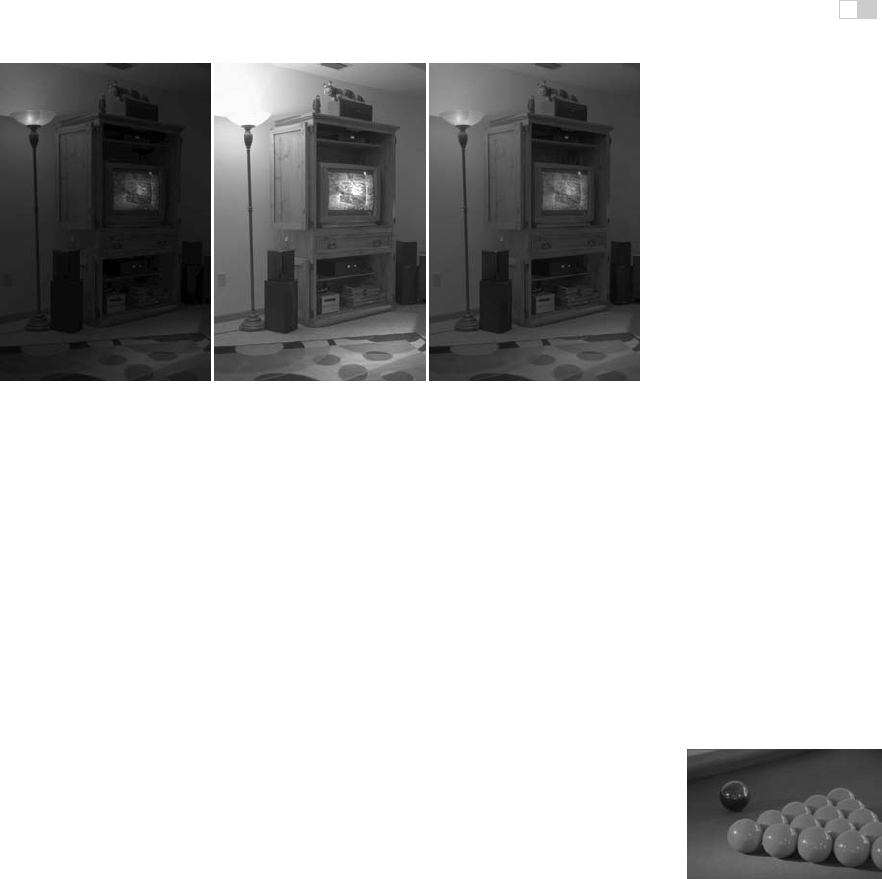
Figure 23.1. With conventional photography, some parts of the scene may be under- or
over-exposed. To visualize the snooker table, the view through the window is burned out in
the left image. On the other hand, the snooker table will be too dark if the outdoor part of this
scene is properly exposed. Compare with Figure 23.2, which shows a high dynamic range
image prepared for display using a tone reproduction algorithm.
door area visible through the window. Humans are easily able to see details of
both the indoor part and the outside part. A conventional photograph typically
does not capture this full range of information—the photographer has to choose
whether the indoor or the outdoor part of the scene is properly exposed (see Fig-
ure 23.1). These decisions may be avoided by using high dynamic range imaging
and preparing these images for display using techniques described in this chapter
(see Figure 23.2).
There are two strategies available to display high dynamicrange images. First,
Figure 23.2. A high dynamic range im-
age tonemapped for display using a recent
tone reproduction operator (Reinhard & De-
vlin, 2005). In this image, both the indoor
part and the view through the window are
properly exposed.
we may develop display devices which
can directly accommodate a high dy-
namic range (Seetzen et al., 2003,
2004). Second, we may prepare high
dynamic range images for display on
low dynamic range display devices (Up-
still, 1985). This is currently the more
common approach and the topic of this
chapter. Although we foresee that high
dynamic range display devices will be-
come widely used in the (near) future,
the need to compress the dynamic range
of an image may diminish, but will not
disappear. In particular, printed media
such as this book are by their very na-
ture low dynamic range.
Compressing the range of values of an image for the purpose of display on
a low dynamic range display device is called tonemapping or tone reproduction.
i
i
i
i
i
i
i
i
599
Figure 23.3. Linear scaling of high dynamic range images to fit a given display device may
cause significant detail to be lost (left and middle). The left image is linearly scaled. In the
middle image high values are clamped. For comparison, the right image is tonemapped,
allowing details in both bright and dark regions to be visible.
A simple compression function would be to normalize an image (see Figure 23.3
(left)). This constitutes a linear scaling which tends to be sufficient only if the dy-
namic range of the image is only marginally higher than the dynamic range of the
display device. For images with a higher dynamic range, small intensity differ-
ences will be quantized to the same display value such that visible details are lost.
In Figure 23.3 (middle) all pixel values larger than a user-specified maximum are
set to this maximum (i.e., they are clamped). This makes the normalization less
dependent on noisy outliers, but here we lose information in the bright areas of
the image. For comparison, Figure 23.3 (right) is a tonemapped version showing
detail in both the dark and the bright regions.
In general linear scaling will not be appropriate for tone reproduction. The
key issue in tone reproduction is then to compress an image while at the same
time preserving one or more attributes of the image. Different tone reproduction
algorithms focus on different attributes such as contrast, visible detail, brightness
or appearance.
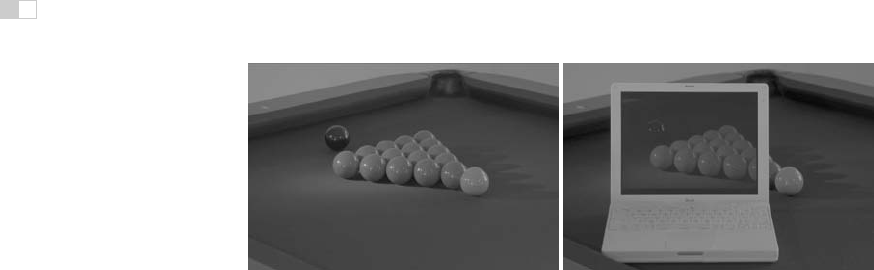
Figure 23.4. Image used
for demonstrating the goal
of tone reproduction in Fig-
ure 23.5.
Ideally, displaying a tonemapped image on a low dynamic range display de-
vice would create the same visual response in the observer as the original scene.
Given the limitations of display devices, this will not be achievable, although we
could aim for approximating this goal as closely as possible.
As an example, we created the high dynamic range image shown in Fig-
ure 23.4. This image was then tonemapped and displayed on a display device.
The display device itself was then placed in the scene such that it displays its own
background (Figure 23.5). In the ideal case, the display should appear transpar-
i
i
i
i
i
i
i
i
600 23. Tone Reproduction
Figure 23.5. After tonemapping the image in Figure 23.4 and displaying it on a monitor,
the monitor is placed in the scene approximately at the location where the image was taken.
Dependent on the quality of the tone reproduction operator, the result should appear as if the
monitor is transparent.
ent. Dependent on the quality of the tone reproduction operator, as well as the
nature of the scene being depicted, this goal may be more or less achievable.
23.1 Classification
Although it would be possible to classify tone reproduction operators by which
attribute they aim to preserve, or for which task they were developed, we classify
algorithms according to their general technique. This will enable us to show the
differences and similarities between a significant number of different operators,
and so, hopefully, contribute to the meaningful selection of specific operators for
given tone reproduction tasks.
The main classification scheme we follow hingesupon the realization that tone
reproduction operators are based on insights gained from various disciplines. In
particular, several operators are based on knowledge of human visual perception.
The human visual system detects light using photoreceptors located in the
retina. Light is converted to an electrical signal which is partially processed in
the retina and then transmitted to the brain. Except for the first few layers of
cells in the retina, the signal derived from detected light is transmitted using im-
pulse trains. The information-carrying quantity is the frequency with which these
electrical pulses occur.
The range of light that the human visual system can detect is much larger
than the range of frequencies employed by the human brain to transmit infor-
mation. Thus, the human visual system effortlessly solves the tone reproduc-
tion problem—a large range of luminances is transformed into a small range of
frequencies of impulse trains. Emulating relevant aspects of the human visual
system is therefore a worthwhile approach to tone reproduction; this approach is
explained in more detail in Section 23.7.
i
i
i
i
i
i
i
i
23.2. Dynamic Range 601
A second class of operators is grounded in physics. Light interacts with sur-
faces and volumes before being absorbed by the photoreceptors. In computer
graphics, light interaction is generally modelled by the rendering equation. For
purely diffuse surfaces, this equation may be simplified to the product between
light incident upon a surface (illuminance), and this surface’s ability to reflect
light (reflectance) (Oppenheim et al., 1968).
Since reflectance is a passive property of surfaces, for diffuse surfaces it is,
by definition, low dynamic range—typically between 0.005 and 1 (Stockham,
1972). The reflectance of a surface cannot be larger than 1, since then it would
reflect more light than was incident upon the surface. Illuminance, on the other
hand, can produce arbitrarily large values and is limited only by the intensity and
proximity of the light sources.
The dynamic range of an image is thus predominantly governed by the illu-
minance component. In the face of diffuse scenes, a viable approach to tone re-
production may therefore be to separate reflectance from illuminance, compress
the illuminance component, and then recombine the image.
However, the assumption that all surfaces in a scene are diffuse is generally
incorrect. Many high dynamic range images depict highlights and/or directly
visible light sources (Figure 23.3). The luminance reflected by a specular surface
may be almost as high as the light source it reflects.
Various tone reproduction operators currently used split the image into a high
dynamic range base layer and a low dynamic range detail layer. These layers
would represent illuminance and reflectance if the depicted scene were entirely
diffuse. For scenes containing directly visible light sources or specular highlights,
separation into base and detail layers still allows the design of effective tone re-
production operators, although no direct meaning can be attached to the separate
layers. Such operators are discussed in Section 23.5.
23.2 Dynamic Range
Conventional images are stored with one byte per pixel for each of the red, green
and blue components. The dynamic range afforded by such an encoding depends
on the ratio between smallest and largest representable value, as well as the step
size between successive values. Thus, for low dynamic range images, there are
only 256 different values per color channel.
High dynamic range images encode a significantly larger set of possible val-
ues; the maximum representable value may be much larger and the step size be-
tween successive values may be much smaller. The file size of high dynamic
..................Content has been hidden....................
You can't read the all page of ebook, please click here login for view all page.