
In this exercise, you will create a document using the imported data from the (TutorialData.xlsx Excel file). The document will feature a grid, a graph, and some selectors to provide the user with interactivity and filtering options:
- In MicroStrategy Developer, log in to the MicroStrategy Analytics Modules Project Source.
- Open the MicroStrategy Tutorial Project and create a new document in the My Exercises folder | Select Blank Document and click OK.
You can also create documents from MicroStrategy Web in a similar way as you do in Developer. To visualize and interact with the document, it is necessary to open it in MicroStrategy Web as Developer doesn't provide the interface to interact with the document's controls.
- Browse and locate the Category Dataset created in the previous exercise. Once you double click on it, the Document Editor will open up. Verify that the dataset is shown on the left pane.
- Remove all document sections with the exception of Detail Header.
Open the Format menu | Document Properties | sections.
- Switch the Datasets left panel to Property List. Make sure both the Document structure and the Control Property window are shown by selecting the second icon on the left pane (two vertical rectangles). Verify that the Body is the only section shown in the Document. Click on Document in the Document structure tree and change the Width to 11, as shown in the following screenshot:

- Click on the Body in the Document structure tree and change the Height to 6.5.
- Switch back to the Dataset pane and drag and drop the Category Dataset to the Body. Switch to the Property List pane, making sure the newly inserted Grid is selected | Change the following properties:
- Backcolor: White (255; 255; 255)
- Border (click on … to open the window): Remove any border then click OK
- Left: 1.9
- Top: 1.125
- Height: 5
- Width: 3.625
The Property window is a contextual pane. It will change depending on which control is selected in the document.
- Now we will insert some controls. Go to Insert | Text and with the cursor create a rectangle anywhere in the Body. Type Bookstore Dashboard. With the text control selected, change the following properties:
- Backcolor: White (255; 255; 255)
- Font: Arial Black, Size 14
- Left: 3.875
- Top: 0.5
- Height: 0.4
- Width: 3

- Choose Save and Close and name it My first Document.
- Now we will test our document. Open MicroStrategy Web and log in to your Project. Browse to the My Exercises folder and click on My first Document.
- Let's add another source. Return to Developer and right-click on Imported Cube | Create Report. Add a Subcategory Attribute and Revenue Metric to the Template | Save and Close | Name it Subcategory Dataset.
- Edit My first Document | Go to the Data | Add Dataset | Locate Subcategory Dataset. You should now see the two Datasets on the left pane.
If the object doesn't show up when you click Add Dataset, change the Object type dropdown to the corresponding object.
- Drag and Drop the Subcategory Dataset to the right side of the existing Grid | right-click on Graph | View Mode | Graph View.
- With the Graph control selected, change the following properties:
- Backcolor: White (255; 255; 255)
- Border (click on … to open the window): Remove any border and click OK
- Left: 5.875
- Top: 1.125
- Height: 4.625
- Width: 4.625
If you double a data control such as a grid or a graph, the upper menu bar changes to provide a different set of commands and formatting options.
- Now we will do some formatting on the graph:
- Double click on Subcategory Graph and go to Gallery | Horizontal Bar | Absolute.
- Go to Graph | Graph Options | Go to the Horizontal Bar Options section on the left. Click on All Text Format | Change Size to 10 and Color to Black. Then, go to Display section | Uncheck Show Legend | Go to Titles section |Value Title (Y) and type Revenue. Go to Series section and check Show Data Labels, then click OK:

- Now we will do some formatting on the grid. Double click on the Category Grid control and go to the Grid menu on the top. Choose AutoStyle Selected | Corporate | Save the Document. Open MicroStrategy Web and run the document again:

- You might have noticed that the document is very simple, lacks interactivity, and is far from good-looking. This is because it is necessary to format every control, position and distribute them, and, most importantly, provide the user with a way to interact with the data. Let's make a few more changes.
- Return to Developer | Edit the Document | Minimize the Document Editor in such a way that both the My Exercises folder and its contents and the Document Editor, are visible at the same time. Drag and drop the Imported Cube into the left Datasets pane of the document.
If the Document Editor window disappears when you click on the Imported Cube, click on the object without releasing the left mouse button and, while holding it (don't drop it yet), press Alt + Tab to switch to the Editor again and drop the Imported Cube within.
- In the Document editor, go to Insert | Selector | Drop-down and draw a rectangle to the left of the grid.
- Right-click on the selector | Properties | General tab | Name: Month Selector | Selector tab | Source dropdown | Month | Click on Manual Targets on the lower-right corner. Disregard the warning message and click OK.
- With the selector control selected, change the following properties:
- Left: 0.1
- Top: 2
- Height: 0.3
- Width: 1.7
- Show title bar: True
- Title: MONTH
- Repeat the process to add a selector but now with the Year attribute. Make sure that on the Selector tab, the Category Dataset, Subcategory Dataset, and Month Selector are selected targets | OK.
With the selector control selected, change the following properties:
- Left: 0.1
- Top: 1.46
- Height: 0.3
- Width: 1.7
- Show title bar: True
- Title: YEAR
- Add a text control and write TIME SELECTIONS. With the text control selected, change the following properties:
- Backcolor: 0; 109; 145
- Left: 0.1
- Top: 1.125
- Height: 0.3
- Width: 1.7

- Save and Close the document.
The time-based selectors that we have added are not present in the Datasets. If you execute the document and test the selectors, you will notice they won't affect the grid or the graph.
- Edit both Category Dataset and Subcategory Dataset and add Year and Month Attributes | Save and Close | Execute the Document | Verify that your selectors change the data on both the grid and graph and that the YEAR sector also changes the Months accordingly. If this is not happening, make sure the Targets on each selector are set correctly.
As you can see, the grid and graph now show data from all categories. We want to restrict it to Books only.
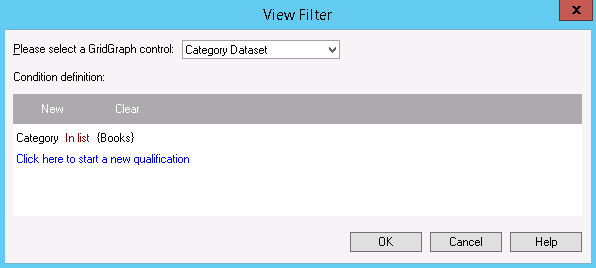
- Edit your Document in Developer | Right click on the Grid | Edit View Filter | New | Field | Category | In list | Select Elements | Books | OK. Then, Save and Close the document:
- Edit your Subcategory Dataset | Add Category to the Template, then Save and Close the Report.
This will allow you to create a View Filter on the graph too.
- Edit your Document | Add a View Filter on the Graph for Books Category too | Save and Close the Document | Execute the Document in Web.
Extra credit
- Add Region and Call Center Attributes to the two datasets and insert two selectors to the document, one for Region (dropdown) and one for Call Center (check box). Your final dashboard should look like this one:

- This finalizes the exercise.
The documents and dashboards can also be visualized in MicroStrategy Mobile. The same objects might not be used. It is recommended to check whether the document dimensions are appropriate for the device (for examples iPad or iPhone).