
Before starting to build Metrics, it is important to understand the Report level in MicroStrategy. Let's use one of the Reports built in the previous exercises, as shown in the next screenshot:
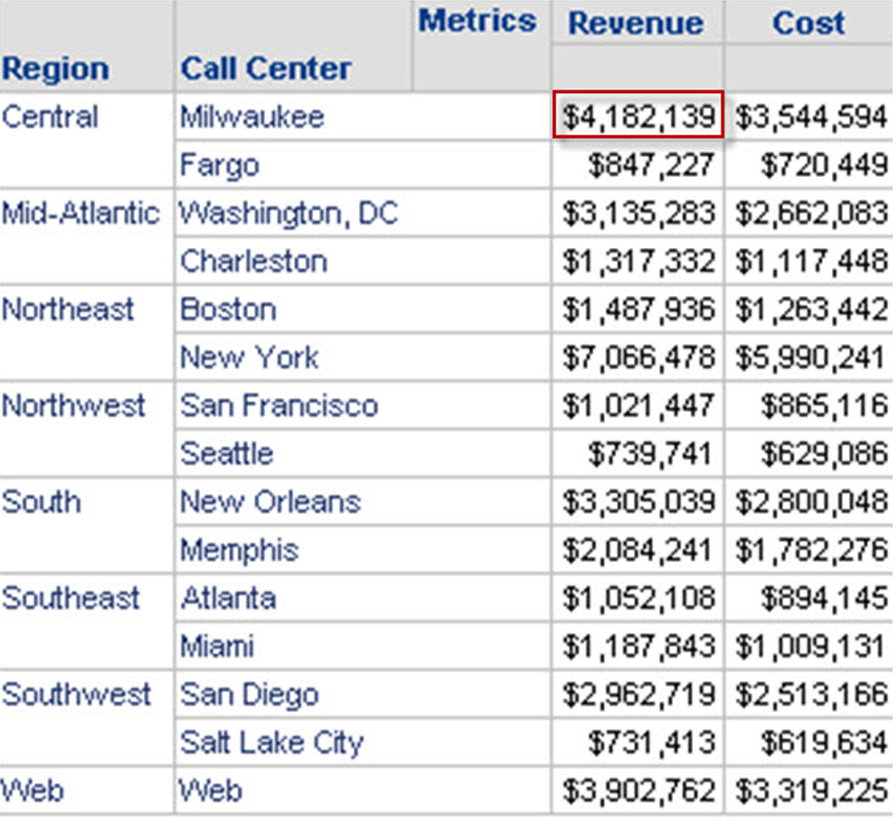
The preceding Report shows revenue and cost Metrics and two Attributes—region and call center. When a user reads the Report it could be understood that either the revenue shown is for a call center or for a region. Due to the layout of the information, it is intuitive that the revenue, for example 4,182,139, is for the Milwaukee call center, which happens to be part of the central region. This is what we call a Report level.
The Report level can be defined as the lowest grain (or business level of aggregation) shown in a Report template. The lowest grain can be from one or more hierarchies or dimensions. For example, if I add the year and month Attributes, the Report will look as follows:

Can you identify the Report level? It would be both month and call center. This means that, by default, the Metrics will be calculated at those two levels—the revenue 114,310 is for Milwaukee and January 2016.