In this exercise you will learn to create different types of Filters. Take the following steps:
- Open the MicroStrategy Tutorial Project | navigate to My Exercises folder.
- For this exercise, we will create a new Report. Right-click | New | Report.
- Add to the Report's local Template the following objects: Region and Call Center Attributes (location: Schema Objects/Attributes/Geography); Revenue and Cost Metrics (location: Public Objects/Metrics/Sales Metrics).
- Execute the Report. You should see the following results:

Screen displayed after executing the Report
- Click on the Design View to access the Report Editor, as shown in the following screenshot:

Design View
It is located below the Save and Close button. The icon is like a red candle.
- You will now create a Filter based on an Attribute. In the Object Browser locate the Region Attribute | drag and drop it to the local Filter section of the Report. Select to qualify on the Region description (DESC) and the Contains operator. In the Value box write down North | and click OK as shown in the next screenshot:

Creating a Filter based on an Attribute
- Execute the Report. You should see only two regions: Northeast and Northwest | Save and Close | name it Regional Revenue and Cost.
Test your knowledge: are the Template and Filters from the above exercise external or local?
Can you reuse them in another Report?
The answers are, they are local objects embedded into the Report definition, and they can't be shared across other objects.
Can you reuse them in another Report?
The answers are, they are local objects embedded into the Report definition, and they can't be shared across other objects.
- Right-click the newly created Regional Revenue and Cost Report | Edit.
- Double-click the Region (DESC) Contains North local Filter | change to qualify on Elements | Add. You will notice a list of regions with a red cube. These are the regions' Attribute elements, in other words, the data stored on the region lookup table.
- Select Central and South and move them to the right side (you can also double-click them) | click OK to close the Attribute element selection | click OK to close the Filter Editor.
- Execute the Report. You should see only two regions: Central and South| File menu | Save (or Ctrl + S) .
- Remove the Filter you just created by returning to the Design view | right-click the Report Filter | Remove.
- Locate the Revenue Metric using the Object Browser | drag and drop it to the Report Local Filter.
You can also grab it from the Report local Template and drag it up to the Filter section.
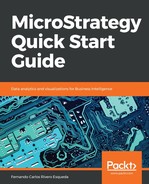
- Qualify the Metric on Value | operator Greater than | 3000000 as shown in the following screenshot:
Qualifying the Metric
- Click OK | execute the Report and verify that only call centers with revenues greater than 3 million are shown.
- Go back to Design view | edit the Local Filter | change the function from Value to Rank | operator Top | value 3.
- Execute the Report. You should see the top three call centers by revenue (New York, Milwaukee, and Web) | Save and Close. This finalizes the exercise.