
In this exercise, you will create a self-service dashboard using the imported data from the (TutorialData.xlsx Excel file ). Take the following steps:
- In MicroStrategy Web, log in to the MicroStrategy Analytics Modules Project Source.
- Open the MicroStrategy Tutorial Project.
- Locate the Imported Cube and right-click on Create Dashboard.
Note that the option to Create a Document in MicroStrategy Web from an iCube it is also available.
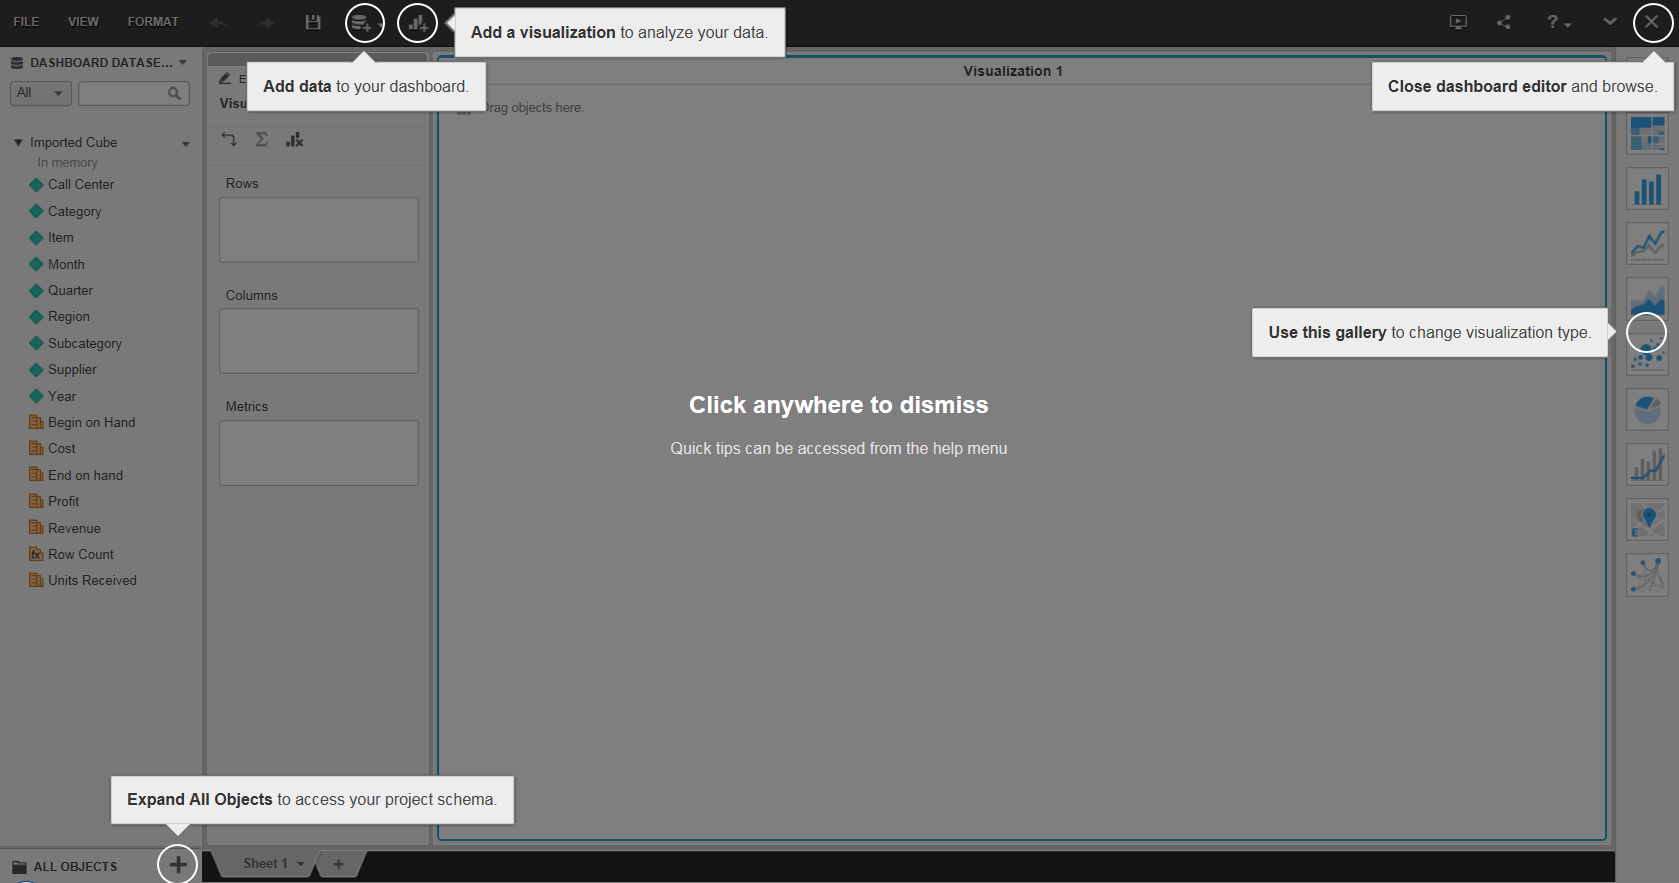
- The first time you create a dashboard, a tutorial splash screen will present the most important sections of the editor, as shown in the following screenshot:
- Drag a Region Attribute, and Revenue and Cost Metrics to the Visualization area. A Grid visualization will be created, similar to a Grid Report.
- On the Visualizations bar (right side of the editor) select the sixth icon which corresponds to the Bubble chart.
- Once the graph is generated, you can control which Metric is associated with y or x axes by dragging the corresponding object to either the Vertical or Horizontal box. Similarly, you can control Color and Size by adding or removing objects from or to those boxes. Drag the Profit Metric to the Size box | Remove Revenue from the Size box.
- Add Revenue to the Color box. Right-click on Revenue in the Color box, choose Thresholds and then choose the color Red-Orange-Green. Click on OK.
You can add as many sheets as you want within the same dashboard by clicking the + symbol (similar to Excel).

- Use the disc icon in the top bar to save or choose File | Save and name it My first Dashboard and click OK.
- This finalizes the exercise.
Similar to documents, dashboards can also be visualized using both MicroStrategy Web and MicroStrategy Mobile.