
If your project is primarily constrained by budget, you’ll want to keep a close eye on resource and task costs and on estimated costs for the project as a whole. You’ll also want to adjust your project plan if you receive any actuals that are likely to blow the budget.
Use one or more of the following techniques to monitor and adjust costs so that you can continue to work within your budget:
Display specialized views and tables to review project costs.
Adjust the schedule to reduce costs.
Adjust assignments to reduce costs.
Note
For details on techniques for monitoring and adjusting costs to achieve a specific budget, see Reducing Project Costs.
Using baseline information you save, you can review your current costs and compare them with baseline costs. For example, you can see baseline costs for tasks (including their resource costs) next to their scheduled costs, based on actuals you enter. Then you can review the variances between the baseline and scheduled cost. The cost variance is calculated as follows:
(Scheduled/Current) Cost – Baseline Cost = Cost Variance
Note
You can use earned value calculations such as the Budgeted Cost of Work Scheduled (BCWS) and Cost Variance (CV) earned value fields to analyze your project performance against the budget so far.
Note
For more information, see Generating Earned Value Data.
There are two ways to review your overall cost totals.
Review project statistics. On the Project tab, in the Properties group, click Project Information, and then click the Statistics button. Under Cost, review the current, baseline, actual, and remaining cost for the project.
Add the project summary task row. On the Format tab, in the Show/Hide group, select the Project Summary Task check box. Summary totals for task information in the current table are displayed in the project summary task row at the top of the task sheet. If a table containing cost information is applied, the project summary task row shows project cost totals.
Use the Cost table to review the differences between your original baseline costs and your currently scheduled costs. The Cost table includes fields containing baseline costs, total scheduled costs, actual costs, remaining costs, and cost variances. To apply the Cost table, follow these steps:
Display the Gantt Chart or other task sheet.
On the View tab, in the Data group, click Tables, and then click Cost.
As shown in Figure 12-14, the Cost table is applied to the current view.
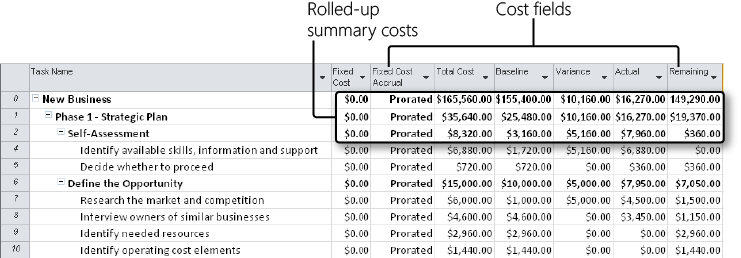
With the project summary task row applied, you can also review rolled-up cost totals.
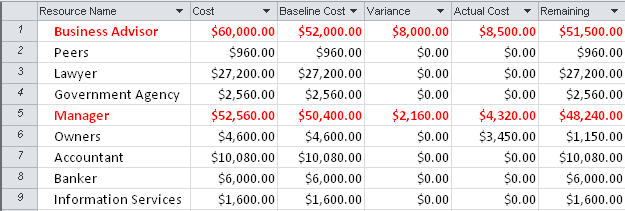
There’s also a cost table for resources, which includes cost information for all a resource’s assignments. With the Resource Sheet or Resource Usage view displayed, apply the Cost table. The Resource Cost table includes the baseline cost, scheduled cost, actual cost, remaining cost, and cost variance for all the resource’s assignments, as shown in Figure 12-15. Cost information is shown for all types of resources—work, material, and cost resources.
You can apply a filter to a task or resource sheet to see only those tasks or resources associated with overbudget costs, as follows:
Display the view and apply the table that contains the information you want to review in the context of overbudget costs.
On the View tab, in the Data group, click the arrow in the Filter box, and then click More Filters.
In the More Filters dialog box, click Cost Overbudget, and then click Apply.
Project 2010 filters for any tasks or resources whose scheduled or actual costs are higher than the baseline costs.
Review the tasks or resources to analyze the extent of the cost overages.
When you finish, show all tasks again. On the View tab, in the Data group, click the arrow in the Filter box, and then click No Filter.
If you prefer to highlight rather than filter for overbudget tasks or resources, use the Highlight tool instead. On the View tab, in the Data group, click the arrow in the Highlight box, and then click More Highlight Filters. To remove highlighting, click No Highlight.
If you set a baseline and are entering actuals, you can evaluate current cost and schedule performance by using earned value calculations. To generate most earned value information, you must have the following items in your project plan:
A saved baseline
Resources assigned to tasks
Costs associated with assigned resources
Actual progress information
To review earned value information, follow these steps:
Display the Gantt Chart or other task sheet.
On the View tab, in the Data group, click Tables, and then click More Tables.
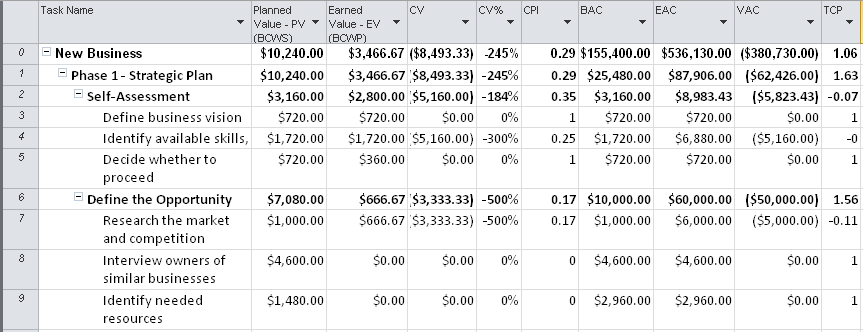
In the dialog box, click Earned Value, Earned Value Cost Indicators, or Earned Value Schedule Indicators, depending on the type of earned value information you want to review.
The table is applied to the task sheet, as shown in Figure 12-16.
To learn details about an earned value field and how best to use and interpret it, follow these steps:
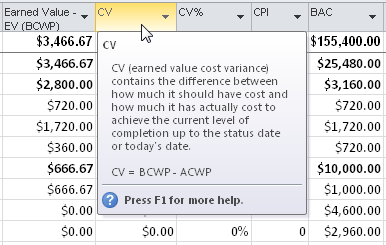
In a task view with an earned value table applied, rest the mouse pointer over an earned value field column header until the ScreenTip appears.
Press F1.
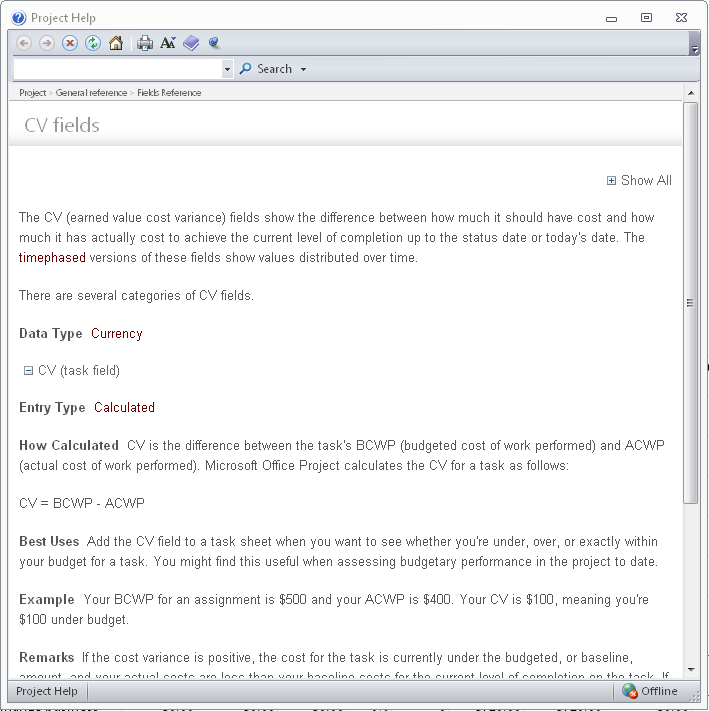
The Project 2010 Help window appears. If necessary, click to expand the category of field you’re using—for example, the task field category. (See Figure 12-17.) Information includes a description of that earned value field, how it’s calculated, its best uses, and an example of its use.
Figure 12-17. Press F1 over any earned value field to get help and detailed information for that field.
Note
For more information about analyzing project performance with earned value, see Reviewing Earned Value Data.
The following filters can help you focus on any potential problems with project costs and budget:
Cost Greater Than (see Figure 12-18)
Cost Overbudget
Late/Overbudget Tasks Assigned To
Work Overbudget
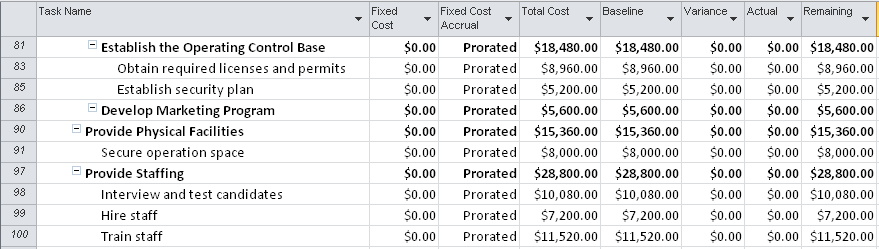
Figure 12-18. The Cost Greater Than filter has been applied to this table to focus on those tasks that have the highest costs.
To apply a filter, on the View tab, in the Data group, click the arrow in the Filter box, and then click More Filters. In the dialog box, click the filter you want and then click Apply or Highlight.
To show all tasks again, on the View tab, in the Data group, click the arrow in the Filter box, and then click No Filter. If you used a filter highlight, click the arrow in the Highlight box, and then click No Highlight.
You can also run text-based and visual reports that provide information about costs and budget status, as follows:
Cash Flow
Budget
Overbudget Tasks
Overbudget Resources
Earned Value
Baseline Cost Report (visual report in Microsoft Excel 2010)
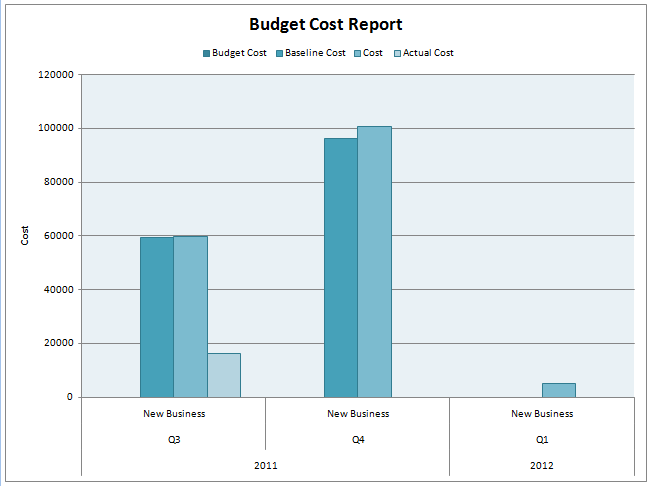
Budget Cost Report (visual report in Excel 2010)
Cash Flow Report (visual reports in Excel or Visio)
Earned Value Over Time Report (visual report in Excel)
Resource Cost Summary (visual report in Excel)
To run a text-based cost report, click Project, Reports, Reports. Double-click Costs, and then double-click the report you want. If a dialog box asks for more information, enter the information, and then click OK. The report appears in the Print Backstage view. You can then print the report to study the details.
To run a visual report, follow these steps:
On the Project tab, in the Reports group, click Visual Reports.
On the All tab, double-click the name of the report you want.
The report is generated from Project 2010 data and displayed in Visio or Microsoft Excel, as shown in Figure 12-19.
Suppose that you reviewed your budget details against the current project costs and found that you will end up significantly over budget. Or perhaps upper management has asked you to cut costs by 10 percent, and you need to work toward a different total project cost.
If you need to take corrective actions in your project plan to reduce project costs, you can do the following:
Recheck your basic cost assumptions such as resource rates, per-use costs for resources, amounts for cost resources assigned to tasks, and fixed costs for tasks.
Adjust the schedule to reduce costs. Reducing task durations and adjusting task dependencies can help reduce costs.
Adjust assignments to reduce costs. Add, remove, or replace resources on assignments as appropriate to cut costs.
Cut scope to reduce costs (which will probably require stakeholder approval).
When you adjust your project plan to achieve the budget you need, be sure to check your finish date, resource allocation, and scope. You need to know how your changes affect other areas of the project plan.
Note
For more information about using any of these strategies to trim project costs, see Reducing Project Costs.
You might also consider setting a new baseline, especially if major cost or schedule changes have occurred.
Note
For more information on setting a new baseline, see Need a New Baseline?.