 Customizing Groups
by Teresa S. Stover, Bonnie Biafore, and Andreea Marinescu
Microsoft® Project 2010 Inside Out
Customizing Groups
by Teresa S. Stover, Bonnie Biafore, and Andreea Marinescu
Microsoft® Project 2010 Inside Out
- Microsoft® Project 2010 Inside Out
- SPECIAL OFFER: Upgrade this ebook with O’Reilly
- A Note Regarding Supplemental Files
- Introduction
- I. Project Fundamentals
- 1. Introducing Microsoft Project 2010
- 2. Understanding Projects and Project Management
- II. Developing the Project Plan
- 3. Starting a New Project
- Getting from Idea to Proposal to Project
- Focusing the Project Vision
- Creating a New Project Plan
- Entering Tasks
- Sequencing and Organizing Tasks
- Organizing Tasks into an Outline
- Setting Up Your Work Breakdown Structure
- Adding Supplementary Information to Tasks
- 4. Viewing Project Information
- Understanding Project Information Categories
- Accessing Your Project Information
- Switching Between Views
- Using Views
- Scheduling with Gantt Charts
- Highlighting Tasks with the Timeline
- Flowcharting with Network Diagrams
- Visualizing the Project with the Calendar
- Reviewing Assignments with the Team Planner
- Charting Team Availability with the Resource Graph
- Tabling with Sheet Views
- Timesheeting with Usage Views
- Seeing Details with Forms
- Cross-Referencing with Combination Views
- Using Tables
- Using Fields
- Arranging Your Project 2010 Window
- Navigating to a Specific Location in a View
- Rearranging Your Project Information
- 5. Scheduling Tasks Manually or Automatically
- 6. Building Your Schedule
- 7. Setting Up Resources in the Project
- Understanding the Impact of Resources in the Plan
- Adding Resources to the Project
- Removing a Resource from the Project
- Identifying Tentative, Generic, or Budget Resources
- Setting When Resources Are Available for Work
- Adding Detailed Resource Information
- 8. Assigning Resources to Tasks
- Assigning Work Resources to Tasks
- Assigning Material Resources to Tasks
- Assigning Cost Resources to Tasks
- Reviewing Assignment Information
- Changing Resource Assignments
- Contouring Resource Assignments
- 9. Planning Resource and Task Costs
- 10. Checking and Adjusting the Project Plan
- Working with the Critical Path and Critical Tasks
- Controlling Schedule Changes with Task Types
- Bringing in the Project Finish Date
- Reducing Project Costs
- Balancing Resource Workloads
- Changing Project Scope
- Reviewing the Impact of Changes
- Obtaining Buyoff on the Project Plan
- 3. Starting a New Project
- III. Tracking Progress
- 11. Setting a Baseline and Updating Progress
- Saving Original Plan Information Using a Baseline
- Updating Task Progress
- Updating Actual Costs
- 12. Responding to Changes in Your Project
- 11. Setting a Baseline and Updating Progress
- IV. Reporting and Analyzing Project Information
- 13. Reporting Project Information
- Establishing Your Communications Plan
- Using Views to Report Project Information
- Generating Text and Visual Reports
- Generating the Right Reports
- Summarizing with Overview Reports
- Focusing on Tasks with Schedule Progress Reports
- Using the Unstarted Tasks Report
- Using the Tasks Starting Soon Report
- Using the Tasks In Progress Report
- Using the Completed Tasks Report
- Using the Should Have Started Tasks Report
- Using the Slipping Tasks Report
- Using the Baseline Report in Visio
- Using the Baseline Work Report in Excel
- Using the Task Status Report in Visio
- Using the Budget Work Report in Excel
- Analyzing Budget Status with Cost Reports
- Using the Cash Flow Report
- Using the Cash Flow Report in Excel
- Using the Cash Flow Report in Visio
- Using the Baseline Cost Report in Excel
- Using the Budget Report
- Using the Budget Cost Report in Excel
- Using the Resource Cost Summary Report in Excel
- Using the Overbudget Tasks Report
- Using the Overbudget Resources Report
- Using the Earned Value Report
- Using the Earned Value Over Time Report in Excel
- Evaluating Resource Allocation with Assignment Reports
- Using the Who Does What Report
- Using the Who Does What When Report
- Using the To-Do List
- Using the Overallocated Resources Report
- Using the Resource Availability Report in Visio
- Using the Resource Work Availability Report in Excel
- Using the Task Usage Report
- Using the Resource Usage Report
- Using the Resource Work Summary Report in Excel
- Using the Resource Remaining Work Report in Excel
- Using the Resource Status Report in Visio
- Revising a Built-In Report
- Building a Custom Report
- Saving Project Data Fields
- Sharing Project Reports Electronically
- 14. Analyzing Progress Using Earned Value
- 13. Reporting Project Information
- V. Managing Multiple Projects
- 15. Managing Master Projects and Resource Pools
- Structuring Master Projects with Subprojects
- Consolidating Project Information
- Opening Multiple Project Files as a Set
- Sharing Resources by Using a Resource Pool
- 16. Exchanging Information Between Project Plans
- 15. Managing Master Projects and Resource Pools
- VI. Integrating Project 2010 with Other Programs
- 17. Exchanging Information with Other Applications
- 18. Integrating Project 2010 with Excel
- 19. Integrating Project 2010 with Visio
- 20. Integrating Project 2010 with Outlook
- 21. Collaborating as a Team by Using SharePoint
- Creating a Project Tasks List on a SharePoint Site
- Exchanging Project Information with SharePoint
- Synchronizing Changes Between Project and SharePoint
- Opening and Viewing Connected Project Information
- Collaborating with Team Members on Task Updates
- Assigning Tasks to Team Members
- Updating Task Progress
- Updating Task Progress in SharePoint
- Updating Task Progress in Project
- VII. Managing Projects Across Your Enterprise
- 22. Understanding Enterprise Project Management
- 23. Administering Your Enterprise Project Management Solution
- Signing In and Out
- Configuring Project Server Security
- Administering the Enterprise Resource Pool
- Establishing the Enterprise Portfolio
- Setting Up Project Workflows
- Standardizing Enterprise Project Elements
- Setting Up Team Member Work Pages
- Managing Pages, Views, and Reports
- 24. Managing Enterprise Projects and Resources
- Connecting to Your Project Server
- Working with Enterprise Projects
- Following a Project Workflow
- Building Your Enterprise Project Team
- Finding Resources to Meet Your Needs
- Building Your Project Team in Project Professional
- Building Your Project Team in Project Web App
- Identifying Resource Attributes by Using Custom Enterprise Fields
- Using Generic Resources as Placeholders
- Adding a Team Assignment Pool to Your Project Resource List
- Finding Enterprise Resources That Meet Specific Criteria
- Review Resource Assignments and Availability
- Replacing an Existing Project Resource with an Enterprise Resource
- Matching an Existing Project Resource
- Matching and Replacing Generic Resources
- Proposing Tentative Resources
- Assigning Tasks to Enterprise Resources
- Finding Resources to Meet Your Needs
- Collaborating with Your Project Team
- 25. Participating on a Team Using Project Web App
- Getting Started with Project Web App
- Working with Your Assignments
- Submitting Text-Based Status Reports
- Logging Time by Using Timesheets
- Working with Issues and Risks
- Setting Up E-Mail Reminders and Outlook Tasks
- Managing Resources in Project Web App
- 26. Making Executive Decisions Using Project Web App
- 27. Managing and Analyzing Project Portfolios
- VIII. Customizing and Managing Project Files
- 28. Customizing Your View of Project Information
- Customizing Views
- Changing the Content of a View
- Creating a New View
- Saving a View
- Changing Text Formatting in Views
- Formatting a Gantt Chart View
- Modifying the Timescale
- Modifying a Network Diagram
- Modifying the Timeline
- Modifying the Team Planner
- Modifying the Resource Graph
- Modifying the Calendar
- Modifying a Sheet View
- Modifying a Usage View
- Customizing Tables
- Customizing Fields
- Working with Outline Codes
- Customizing Groups
- Customizing Filters
- Sharing Customized Elements Among Projects
- Customizing Views
- 29. Customizing the Project 2010 Interface
- 30. Automating Your Work with Macros
- 31. Standardizing Projects by Using Templates
- 32. Managing Project Files
- Saving Project Files
- Opening Project Files
- Saving and Opening with Different File Formats
- Comparing Project Plans Side by Side
- Safeguarding Your Project Files
- 28. Customizing Your View of Project Information
- IX. Appendixes
- D. Index to Troubleshooting Topics
- E. About the Authors
- Index
- About the Authors
- SPECIAL OFFER: Upgrade this ebook with O’Reilly
In Project 2010, groups can collate tasks, resources, or assignments that meet a set of conditions. For example, you might group tasks by their schedule variance so that you can concentrate on the ones furthest behind schedule. You might group resources by their level of availability so that you can assign the resources who have the most free time. You can also choose to group assignments instead of tasks or resources, for example, to see which assignments are running over on the targeted hours.
Group summary rows show subtotals for the values in the numeric fields for the group. For example, assignments grouped by salaried employees, hourly employees, and contractors can show the total hours of work performed by each group. When you group these elements, subtotals for the groups appear in the Task and Resource Sheet as well as in the timesheet area in usage views.
Note
For information about applying built-in groups, see Grouping Project Information into Categories in Chapter 4.
If one of the existing groups doesn’t meet your needs, you can modify a built-in group or create your own. If you want to keep the original group definition intact, simply copy an existing group and then modify the copy with the criteria you want. Do the following to customize a group:
On the View tab, in the Data group, click the arrow next to the Group box, and then click More Groups.
In the More Groups dialog box, click either the Task or Resource option to display the existing task or resource groups.
Click the group you want to modify in the list, and then click Edit or Copy.
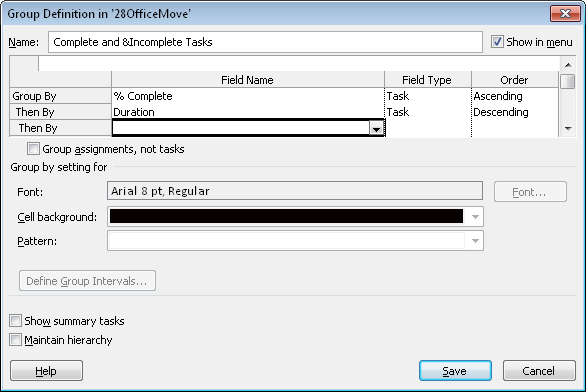
The Group Definition dialog box appears.
If you have copied an existing group, in the Name box, change the name of the group.
Click the first empty cell in the Field Name column, click the arrow, and then click the name of the field by which you want to group.
The category for the field (Task, Resource, or Assignment) appears in the Field Type cell, as you can see in Figure 28-25.
If necessary, change the grouping order.
Choose Ascending to show the smallest numbers first—for example, to see the tasks that have the least amount of completed work as shown in the % Complete field. Descending order shows the largest values first, which is ideal for locating the resources with the most availability.
To change the font for group rows, click Font. In the Font dialog box, choose a font, font style, font size, and color.
To change the background color for cells in group rows, click a color in the Cell Background box.
To change the pattern for the group headings, click a pattern in the Pattern box.
Note
For task usage views, you can group by tasks or assignments. If you want to see groupings by individual assignments within a task group, select the Group Assignments, Not Tasks check box. For resource usage, you can group by resources or assignments by selecting the Group Assignments, Not Resources check box for a resource group.
Troubleshooting: You can’t change the calculation for the value that appears in the group heading row
The group heading rows for standard fields display the sum of the values for the entries in the group. However, you might want to use a different calculation for the group heading row, such as the largest value or the average.
Although you can’t change the calculation for a standard field group summary, you can create a custom field equal to the standard field. Then you can calculate the group summary for the custom field by using the other summary calculations. To do this, first modify a custom field and use a formula to set the custom field equal to the standard field. Then, in the Custom Fields dialog box, select the Rollup option and choose the calculation you want to use for the rolled-up value.
Groups often display elements in small sets, one set for each discrete value that exists for the field that you grouped. This process works well for fields such as Milestones that have only two values. For groups based on cost or work, the number of discrete values can seem endless. The solution to this dilemma is to define intervals for groups—for example, to group tasks by % Complete equal to 0%, from 1% to 50%, from 51% to 99%, and finally 100%. To do this, follow these steps:
In the Group Definition dialog box, click the field for which you want to define intervals.
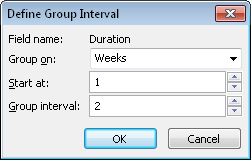
Click Define Group Intervals. The Define Group Interval dialog box appears, as shown in Figure 28-26.
The default selection for Group On is Each Value, which creates a separate group for each discrete value in the field.
Click the arrow in the Group On box, and then click the interval you want to use in the list.
The intervals listed depend on the type of field. For example, the intervals for a field that represents work include units in which work is measured, such as hours, days, weeks, and months. For % Complete, the list includes several common sets of intervals.
To start the interval at a specific number, type the number in the Start At box.
To define the interval size, type the number in the Group Interval box. To group assignments in intervals of 2 weeks worth of work, type 2.
When no groups exist that are similar to what you want, you can create a new group. To create a new group, do the following:
On the View tab, in the Data group, click the arrow next to the Group box, and then click More Groups.
In the More Groups dialog box, select the Task or Resource option to specify whether you’re creating a task or resource group, and then click New.
In the Name box, type a descriptive name for the new group.
To define the group, follow the steps described in Modifying a Group.
Group Tasks with Overallocated Resources
You can create and apply a custom group that shows which tasks have overallocated resources assigned to them. This can help you determine which tasks are more at risk of missing their dates or generating overtime costs. To do this, complete these steps:
On the View tab, in the Data group, click the arrow next to the Group box, and then click More Groups.
In the More Groups dialog box, select the Task option and then click New.
In the Name box, type Overallocated.
Select the Show In Menu check box.
Click in the Group By row in the Field Name column, click the arrow, and then type ov to scroll directly to the Overallocated field.
Click in the Order cell in the same row, click the arrow, and then click Descending to show the overallocated group first.
Click Save to save the group.
Your new group appears in the More Groups dialog box. Because the Overallocated field is a Yes/No field, the view is divided into two groups: those tasks that have overallocated resources assigned and those that do not.
Click Apply to initiate the Overallocated grouping to the current view. Click Close to close the dialog box without grouping.
Any time you want to apply the Overallocated grouping to a task view, on the View tab, in the Data group, click the arrow next to the group box, and then click Overallocated.
Inside Out: Different “groups” in Project 2010
Project 2010 uses the term “group” to describe several different features. Each feature serves a different purpose, so it’s important to choose the correct one.
A group resource represents several interchangeable resources. For example, you might define a resource called Carpenters, which represents five carpenters who can do basic carpentry. The maximum units for this resource would be the sum of the maximum units for each individual in the group resource, 500 percent in this example.
A resource group represents a category of individual resources. You might define a resource group for employees and another for contractors so that you can sort, filter, and view assignments that are performed in-house versus those that are outsourced.
Throughout Microsoft Office, each subsection on the ribbon is referred to as a group. For example, the Task tab of the Project 2010 ribbon contains the View group, the Schedule group, and so on.
Finally, a group that you apply using the Group command on the View tab categorizes and sorts tasks, resources, or assignments based on the values in any field in Project 2010.
-
No Comment