
Not every machine has the luxury of being able to write logfiles. Sending data over network ports and protocols is still very common. For instance, sending logs via syslog is still the primary method to capture network device data such as firewalls, routers, and switches.
Sending data to Splunk over network ports doesn't need to be limited to network devices. Applications and scripts can use socket communication to the network ports that Splunk is listening on. This can be a very useful tool in your back pocket, as there can be scenarios where you need to get data into Splunk but don't necessarily have the ability to write to a file.
This recipe will show you how to configure Splunk to receive syslog data on a UDP network port, but it is also applicable to the TCP port configuration.
To step through this recipe, you will need a running Splunk Enterprise server. No other prerequisites are required.
Follow the steps in the recipe to configure Splunk to receive network UDP data:
- Log in to your Splunk server.
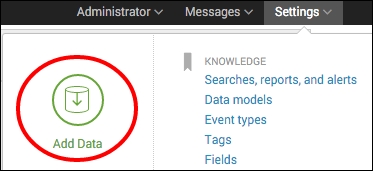
- From the menu in the top right-hand corner, click on the Settings menu and then click on the Add Data link.
- If you are prompted to take a quick tour, click on Skip.
- In the How do you want to add data? section, click on monitor.

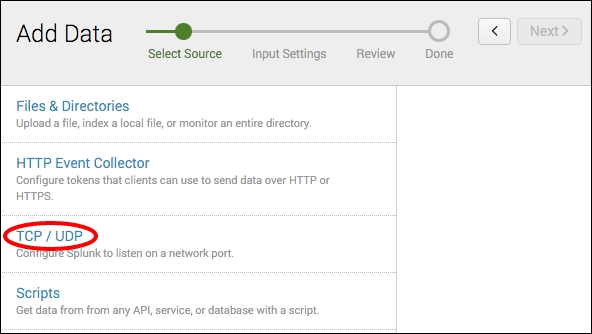
- Click on the TCP / UDP section.
- Ensure the UDP option is selected and in the Port section, enter
514. On Unix/Linux, Splunk must be running as root to access privileged ports such as 514. An alternative would be to specify a higher port such as port 1514 or route data from 514 to another port using routing rules in iptables. Then click on Next.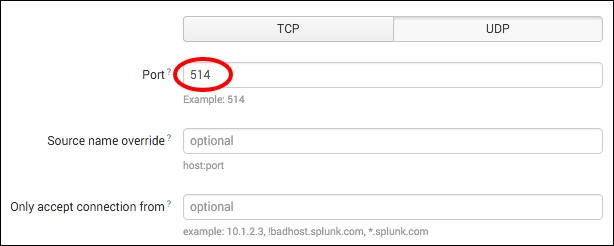
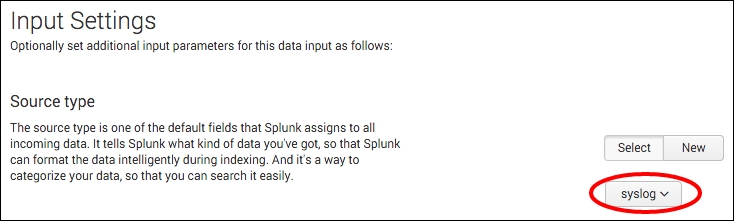
- In the Source type section, select From list from the Set sourcetype drop-down list, and then, select syslog from the Select Source Type drop-down list and click Review.
- Review the settings and if everything is correct, click Submit.
- If everything was successful, you should see a UDP input has been created successfully message.

- Click on the Start searching button. The Search & Reporting app will open with the search already populated based on the settings supplied earlier in the recipe. Splunk is now configured to listen on UDP port 514. Any data sent to this port now will be assigned the syslog source type. To search for the syslog source type, you can run the following search:
source="udp:514" sourcetype="syslog"
Understandably, you will not see any data unless you happen to be sending data to your Splunk server IP on UDP port 514.
When you add a new network port input, you basically add a new configuration stanza into an inputs.conf file behind the scenes. The Splunk server can contain one or more inputs.conf files, and these files are either located in the $SPLUNK_HOME/etc/system/local or the local directory of a Splunk app.
To collect data on a network port, Splunk will set up a socket to listen on the specified TCP or UDP port and will index any data it receives on that port. For example, in this recipe, you configured Splunk to listen on port 514 for UDP data. If data was received on that port, then Splunk would index it and assign a syslog source type to it.
Splunk also provides many configuration options that can be used with network inputs, such as how to resolve the host value to use on the collected data.
Tip
For more information on Splunk's configuration files, visit http://docs.splunk.com/Documentation/Splunk/latest/Admin/Aboutconfigurationfiles.
While adding inputs to receive data from network ports can be done through the web interface of Splunk, as outlined in this recipe, there are other approaches to add multiple inputs quickly; these inputs allow for customization of the many configuration options that Splunk provides.
You can also add a file or directory input via the Splunk CLI. Navigate to your $SPLUNK_HOME/bin directory and execute the following command (just replace the protocol, port, and source type you wish to use):
For Unix:
./splunk add udp 514 –sourcetype syslog
For Windows:
splunk add udp 514 –sourcetype syslog
There are a number of different parameters that can be passed along with the port. See the Splunk documentation for more on data inputs using the CLI (http://docs.splunk.com/Documentation/Splunk/latest/Data/MonitorfilesanddirectoriesusingtheCLI).
Network inputs can be manually added to the inputs.conf configuration files. Edit $SPLUNK_HOME/etc/system/local/inputs.conf and add your input. You will need to restart Splunk after modifying the file:
[udp://514]
sourcetype = syslog
Tip
It is best practice to not send syslog data directly to an indexer. Instead, always place a forwarder between the network device and the indexer. The Splunk forwarder would be set up to receive the incoming syslog data (inputs.conf) and will load balance the data across your Splunk indexers (outputs.conf). The forwarder can also be configured to cache the syslog data in the event communication to the indexers is lost.