
Sometimes, the most common website-operational issues relate to malicious users operating on the site or attempting malicious activities. One of the simpler and more common activities is to attempt to spoof the session identifier to that of a legitimate one in the hope that a session can be hijacked. Typically, web applications are built for proper session handling, but mistakes can be made and even the best web applications can fall victim to simple session spoofing or hijacking. Understanding the impact that this can have on the operation of the website, we will leverage a common command we used throughout this chapter to identify any potential malicious use and flag it for investigation.
In this recipe, you will write a Splunk search to aid in the identification of potential session spoofing over a given period of time. The results will be presented in a tabular format and added to a dashboard.
To step through this recipe, you will need a running Splunk Enterprise server, with the sample data loaded from Chapter 1, Play Time – Getting Data In. You should have also completed the earlier recipes in this chapter and be familiar with navigating the Splunk user interface.
Follow the steps in this recipe to identify potential session spoofing activity:
- Log in to your Splunk server.
- Select the Operational Intelligence application.
- Ensure the time range picker is set to Last 24 hours and type the following search into the Splunk search bar. Then, click on the search button or hit Enter.
index=main sourcetype=access_combined | transaction JSESSIONID | eval count_of_clientips=mvcount(clientip) | where count_of_clientips > 1 | table _time, count_of_clientips, clientip, JSESSIONID | sort count_of_clientips
- Splunk will return the results in a tabular format.
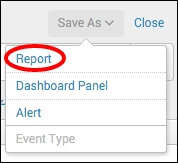
- Let's save this search as a report. Click on Save As and choose Report from the drop-down menu.
- In the Save As Report pop-up box that appears, enter
cp06_potential_session_spoofingin the Title field and then click on Save.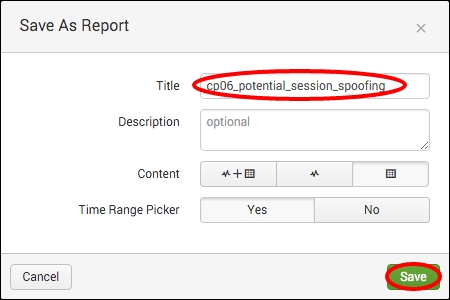
- You will receive a confirmation that your report has been created. Now, let's add this report to the Session Monitoring dashboard you created earlier in this chapter. In the next window, click on Add to Dashboard.

- In the Save As Dashboard Panel pop-up box, click on the Existing button beside the Dashboard label and select Session Monitoring from the drop-down menu. Enter
Potential Session Spoofingin the Panel Title field and ensure the Panel Powered By is set to Report. Then, click on Save.
- You can now click on View Dashboard to see your newly added panel.
In this recipe, you wrote a search to detect spoofed sessions. Essentially, the search looks for where a single session identifier (JSESSIONID) is associated with multiple client IP addresses over the given time range of 24 hours. Understandably, in almost all cases, a session identifier will only come from a single client IP address. So, if there are sessions that have multiple IPs, then this can very well detect spoofing of a session. Results will only be displayed where there is more than one client IP associated with a specific session.
Let's break down the search piece by piece:
|
Search fragment |
Description |
|---|---|
|
|
You should now be familiar with this search from the earlier recipes. It is used to return events from the website access log. |
|
|
Using the |
|
|
Using the |
|
|
Using the |
|
|
The |
|
|
The |
Besides presenting the data sorted based on the count of client IPs that were associated with a given session identifier, logic can be applied to ensure events that meet specific criteria and are raised higher in the list when compared to others.
Not all session spoofings are alike, and therefore, they need to be responded to differently according to the urgency associated with the event. For example, a session might be spoofed, but this session is not in the midst of any purchasing, and therefore, the potential financial loss to either the website or the consumer is extremely low. Another session is spoofed in the middle of making over $1,000 in purchases, and therefore, the potential financial loss to the parties involved is substantial.
You can build some common logic into your search based upon given values to increase the urgency associated with an event. In the following example, we bring together the website access and web application logs to enhance the amount of information we have access to. We then set up specific conditions that increase the urgency based on the values stored within the given events.
index=main sourcetype=access_combined| join JSESSIONID usetime=true earlier=false [ search index=main sourcetype=log4j | transaction threadId | eval JSESSIONID=sessionId ] | transaction JSESSIONID | eval count_of_clientips=mvcount(clientip) | where count_of_clientips > 1 | eval cost_urgency=if(itemPrice>=1000,"2","1") | eval frequency_urgency=case(count_of_clientips=="2","1", count_of_clientips=="3","2",1=1,"3") | eval urgency=cost_urgency + frequency_urgency | table _time, count_of_clientips, clientip, JSESSIONID | sort urgency
In this example, we join the field values from the web application log with the website access log, and then build a transaction of the session identifiers within the website access log. Next, we count the number of clientip values associated with each unique session identifier and ensure that only the events with more than one clientip are returned. We now add further logic to say that if the itemPrice field value is greater than or equal to $1,000, then the cost_urgency field value be raised to 2, otherwise it remains at 1. The next piece of logic looks at the number of clientip fields associated with the unique session identifier and assigns a value to frequency_urgency accordingly. The values of cost_urgency and frequency_urgency are then added together to form the overall urgency value. The tabulated results are then sorted based on the overall urgency, allowing teams to focus more clearly on the most important incidents.